
最新刊期
卷 25 , 期 9 , 2020
-
 摘要:Remote sensing edge intelligence technology has become an important research topic due to the rapid development of aerospace, remote sensing, and communication as well as the innovation of 5G and other efficient communication technologies. Remote sensing edge intelligence technology aims to achieve the front of intelligent application and perform efficient information analysis and decision making at a location close to the data source. This technology can be effectively used in satellite on-orbit processing and interpretation, unmanned aerial vehicle(UAV) dynamic real-time tracking, large-scale urban environment reconstruction, automatic driving recognition planning, and other scenarios to saving a considerable amount of transmission bandwidth, processing time, and resource consumption and achieve fast, accurate, and compact design of intelligent technology algorithm. We summarize the research status of edge intelligence in remote sensing in this study. First, we discuss the problems faced by the current remote sensing field in deployment of applications on edge devices, namely, 1) limitation of number of samples: compared with visual scene images, remote sensing data continue to be a problem of small samples. Remote sensing scenes contain a large number of complex backgrounds and target categories, but the actual number of effective samples is relatively small. Newly emerged and modified targets typically face serious problems of uneven distribution of categories. 2) Limitation of computing resources: coverage area of remote sensing images that can generally reach several or even hundreds of kilometers and data size of a single image that can reach up to several hundred GBs require a large amount of storage space for edge devices. In addition, the increasing complexity of deep learning models increases the requirements for computing power resources. Therefore, remote sensing edge intelligence must solve the contradiction between model complexity and power consumption on edge devices. 3) Catastrophic forgetting: new tasks and categories continue to emerge in the analysis of remote sensing data. Existing algorithms have poor generalization ability for continuous input data. Hence, continuous learning must also be solved to maintain high accuracy and high performance of algorithms. We then introduce solutions and primary technical approaches to related problems, including generalized learning in the case of small samples, design and training strategy of the lightweight model, and continuous learning for multitasks. 1) Generalized learning in the case of small samples: we summarize existing solutions into two categories, namely, combine characteristics of remote sensing images to expand the sample intelligently and meet data requirements of the model training as well as introduce priority knowledge from the perspective of knowledge reuse through different learning strategies, such as transfer learning, meta- learning, and metric learning, to assist the model in learning new categories and reduce the model's need for remote sensing data. 2) Design and training strategy of the lightweight model: the former introduces convolution calculation unit design, artificial network design, automatic design, model pruning and quantification methods, while the latter compares training frameworks based on knowledge distillation and traditional training methods. 3) Continuous learning for multitasks: the first category is based on the reproduction of sample data. The model plays back stored samples while learning new tasks by storing samples of previous tasks or applying a generated model to generate pseudo samples to balance the training data of different tasks and reduce the problem of catastrophic forgetting. The second category is based on the method of model structure expansion. The model is divided into subsets dedicated to each task by constraining parameter update strategies or isolating model parameters. The method of model structure expansion improves the task adaptability of the model and avoids catastrophic forgetting without relying on historical data. Furthermore, combined with typical applications of remote sensing edge intelligence technology, we analyze the advantages and disadvantages of representative algorithms. Finally, we discuss challenges faced by remote sensing edge intelligence technology and future directions of this study. Further research is required in remote sensing edge intelligence technology to improve its depth and breadth of application.关键词:remote sensing data;edge intelligence;few-shot learning;lightweight model;continuous learning89|77|5更新时间:2024-05-07
Scholar View

-
 摘要:Infrared acquisition technologies are not easily disturbed by environmental factors and have strong penetrability. In addition, the effect of infrared acquisition is mainly determined by the temperature of the object itself. Therefore, such technology has been widely used in the military field, such as in infrared guidance, infrared antimissile, and early warning systems. With the rapid development of computer vision and digital image processing technologies, infrared small-target detection has gradually become the focus and challenge of research, and the number of relevant methods and kinds of infrared small-target detection techniques are increasing. However, given the characteristics of small imaging area, long distance, lack of detailed features, weak shape features, and low signal-to-noise ratio, infrared dim- and small-target detection technology has always been a key technical problem in infrared guidance systems. In this study, two kinds of methods, which are based on single-frame images and infrared sequence and extensively used at present, are reviewed. This work serves as basis for follow-up research on the theory and development of small-target detection. The corresponding infrared small-target algorithm is selected for comparison on the basis of the analysis of the characteristics of the target and background in infrared small-target images and the difficulties of infrared small-target detection technology, in accordance with whether the interframe correlation information is used, and from the perspective of single-frame infrared image and infrared sequence. Single-frame based algorithms can be divided into three categories, including filtering methods, human vision system based methods low-rank sparse recovery base methods.The method based on filtering estimates the background of infrared images, using the frequency difference among the target, background and clutter to filter the background and clutter, to achieve the effect of background suppression. The method based on human vision systems mainly uses the visual perception characteristics of human eyes, that is, the appearance of small targets results in considerable changes of local texture rather than global texture. In recent years, the method based on low-rank sparse recovery has been widely used; it is also an algorithm with improved effect in single-frame image detection. This kind of algorithm maximizes the sparsity of small targets, the low rank of backgrounds, and the high frequency of clutter. Moreover, it uses optimization algorithms to solve the objective function and gradually improve the accuracy of detection in the process of iteration. However, this kind of infrared small-target detection method based on single-frame images requires a high signal-to-noise ratio and does not take advantage of the correlation between adjacent frames; thus, it is prone to false detection and demonstrates a relatively poor performance in real time. Therefore, a sequence-based detection method based on spatial-temporal correlation is introduced. For the detection of small moving infrared targets, prior information, such as the shape of small targets, the continuity of gray level change in time, and the continuity of moving track, is key to segment noise and small targets from infrared images effectively. Therefore, in accordance with the order of using these prior information, current mainstream infrared moving small-target detection methods are divided into two categories: detect before motion (DBM) and motion before detect (MBD). These two kinds of algorithms have different application ranges according to their own characteristics. The DBM method is relatively simple, easy to explement, and widely used in tasks with high real-time requirements. By contrast, the MBD method has high detection rate and low false alarm rate and can achieve good detection results in low signals to clutter ratio backgrounds. In this review, the principle, process, and characteristics of typical algorithms are introduced in detail, and the performance of each kind of detection algorithm is compared. At present, infrared small-target detection technologies may have reliable performance in short-term small-target detection and tracking tasks; however, the difficulty of small-target detection is prominent due to complex application scenarios, high requirements for long-term detection, and the particularity of target and background in practical applications. Therefore, according to the characteristics of infrared small targets, this work analyzes the difficulties of infrared small-target detection methods, provides solutions and shortcomings of various algorithms, and discusses the development direction of infrared small-target detection. Thus far, infrared small-target detection technologies have made remarkable progress and have been widely used in infrared guidance and antimissile tasks. However, infrared small-target detection technologies still suffer from some problems. For the characteristics of infrared small-target detection, we need to test and improve the detection theory of small targets further. To improve the detection effect of small targets in infrared images, we must constantly study the corresponding detection methods and improve the schemes. The application of infrared dim- and small-target detection is challenging and complex. The robustness and accuracy of the corresponding algorithms are constantly improved, and the detection speed is also required to meet real-time requirements. Combined with the application characteristics and scope of different military equipment, a universal overseas small-target detection algorithm should be studied. The algorithm should have high accuracy and robustness and must meet real-time requirements to enhance the all-weather reconnaissance capability and the target battlefield information collection capability of the equipment. Therefore, we can also summarize the major development directions of infrared small-target detection technology in the future. First, from the perspective of image fusion of different imaging systems, imaging quality is improved. Second, the existing algorithm is improved by combining the spatial-temporal information of images and the idea of iterative optimization. Third, several datasets are collected, and deep learning methods are explored to improve the accuracy of detection algorithm. Lastly, the improvements of hardware systems are used to accelerate the algorithm and improve the real-time detection. In the future, we will conduct corresponding research from these directions.关键词:infrared image;infrared sequences;infrared small target;low-rank and sparse representation(LRSR);small-target detection442|412|20更新时间:2024-05-07
 -
 摘要:General object detection has been one of most important research topics in the field of computer vision. This task attempts to locate and mark an object instance that appears in a natural image using a series of given labels. The technique has been widely used in actual application scenarios, such as automatic driving and security monitoring. With the development and popularization of deep learning technology, the acquisition of the semantic information of images has become easier; thus, the general object detection framework based on convolutional neural networks (CNNs) has obtained better results compared with other target detection methods. Given that the large-scale dataset of the task is relatively better than datasets designed for other vision tasks and the metrics are well defined, this task rapidly evolves in CNN-based computer vision tasks. However, general object detection tasks still face many problems, such as scale and illumination changes and occlusions, due to the limitations of the CNN structure. Given that the features extracted by CNNs are sensitive to the scale, multiscale detection is often valuable but challenging in the field of CNN-based target detection. Research on scale transformation also has reference value for other scales in small target- or pixel-level tasks, such as the semantic segmentation and pose detection of images. This study mainly aims to provide a comprehensive overview of object detection strategies for scales in CNN architectures, that is, how to locate and classify different sizes of targets robustly. First, we introduce the development of general target detection problems and the main datasets used. Then, we introduce two categories of the general object detection framework. One of the categories, i.e., two-stage strategies, first obtains the region proposals and then selects the proposals by points of classification confidence; it mostly takes region-based convolutional neural networks (RCNN) as the baseline. With the development of the RCNN structure, all the links are transformed into specific convolution layers, thus forming an end-to-end structure. In addition, several tricks are designed for the baseline to solve specific problems, thus improving the robustness of the baseline for all kinds of object regions. The other category, i.e., one-stage strategies, obtains the region location and category by regressing once; it starts with a structure named "you only look once" which regresses the information of the object for every block divided. Then, the baseline becomes convolutional and end to end and uses deep and effective features. This baseline has also become popular since focal loss has been proposed because it solves the problem in which regression may cause an unbalance of positive and negative samples. Besides, some other methods, which detect objects via point location and learn from pose estimation tasks, also obtain satisfactory results in general target detection. We then introduce a simple classification of the optimization ideas for scale problems; these ideas include multi-feature fusion strategies, convolution deformations for receptive fields, and training strategy designs. Multi-feature fusion strategies are used to detect the classes of objects that are not always performed in a small scale. Multi-feature fusion can obtain semantic information from different image scales and fuse them to attain the most suitable scale. It can also effectively identify the different sizes of one-class objects. Widely used structures can be divided as follows: those that use single-shot detection and those with feature pyramid networks. Some structures have a jump layer fusion design. In a receptive field, every feature corresponds with an image or lower-level feature. The specific design can solve a target that always appears small in the image. The general receptive field of a convolution is the same as the size of the kernel; another special convolution kernel is designed. Dilated kernels are the most deformed kernels, which are used with the designed pooling layer to obtain a dense high-level feature. Some scholars have designed an offset layer to attain the most useful deformation information automatically for the convolution kernel. A training strategy can also be designed for small targets. A dataset that only includes small objects can be designed, and different sizes of the image can be trained in the structure in an orderly manner. Resampling images is also a common strategy. We provide the detection accuracy results for different sizes of targets on common datasets for different detection frameworks. Results are obtained from the Microsoft common objects in context (MS COCO) dataset. We use average precision (AP) to measure the result of the detection, and the result set includes results for small, medium, and large targets and those for different intersection-over-union thresholds. It shows the influence of the changes for scale. This study provides a set of possible future development directions for scale transformation. It also includes strategies on how to obtain robust features and detection modules and how to design a training dataset.关键词:image semantic understanding;general object detection;convolutional neural network (CNN);scale changing;small target detection23|42|1更新时间:2024-05-07
Review
-
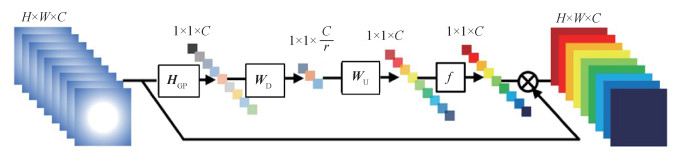 摘要:ObjectiveSingle-image super-resolution (SISR) techniques aim to reconstruct a high-resolution image from a single low-resolution image. Given that high-resolution images contain substantial useful information, SISR technology has been widely used in medical imaging, face authentication, public relations, security monitoring, and other tasks. With the rapid development of deep learning, the convolution neural network (CNN)-based SISR method has achieved remarkable success in the field of SISR. From super-resolution CNN (SRCNN) to residual channel attention network (RCAN), the depth and the performance of the network have considerably improved. However, some problems need to be improved. 1) Increasing the depth of a network can improve reconstruction performance effectively; however, it also increases the calculation complexity of the network and leads to a poor real-time performance. 2) An image contains a large amount of high- and low-frequency information. The area with high-frequency information should be more important than the area with low-frequency information. However, most recent CNN-based methods treat these two areas equally and thus lack flexibility. 3) Feature maps at different depths carry different receptive field information with different scales. Integrating these feature maps can enhance the information flow of different convolution layers. Most current CNN-based methods only consider feature maps with a single scale. To solve these problems, we propose a lightweight hierarchical feature fusion spatial attention network to learn additional useful high-frequency information.MethodThe proposed network is mainly composed of four parts, namely, the shallow feature extraction, hierarchical feature fusion, up-sampling, and reconstruction parts. In the shallow feature extraction part, a convolution layer is used to extract the shallow feature and expand the number of channels. The hierarchical feature fusion part comprises nine residual attention blocks, which are evenly divided into three residual attention groups, each of which contains three residual attention blocks. The feature maps at different depths are fused by using local and global feature fusion strategies. On the one hand, the local feature fusion strategy is used to fuse the feature maps obtained by the three residual attention blocks in each residual attention group. On the other hand, the global feature fusion strategy is used to fuse the feature maps obtained by three residual attention groups. The two feature fusion strategies can integrate feature maps with different scales to enhance the information flow of different depths in the network. This study focuses on the residual attention block, which is composed of a residual block module and a spatial attention module. In each residual attention block, two 3×3 convolution layers are first used to extract several feature maps, and then a spatial attention module is used to assign different weights to different spatial positions for different feature maps. The core problem is how to obtain the appropriate weight set. According to our analysis, pooling along the channel axis can effectively highlight the importance of the areas with high-frequency information. Hence, we first apply average and maximum pooling along the channel axis to generate two representative feature descriptors. Afterward, a 5×5 and a 1×1 convolution layer are used to fuse the information in each position with its neighbor positions. The spatial attention value of each position is finally obtained by using a sigmoid function. The third part is the up-sampling part, which uses subpixel convolution to upsample the low-resolution (LR) feature maps and obtain a large-scale feature map. Lastly, in the reconstruction part, the number of channels is compressed to the target number by using a 3×3 convolution layer, thus obtaining a reconstructed high-resolution image. During the training stage, a DIVerse 2K(DIV2K) dateset is used to train the proposed network, and 32 000 image patches with a size of 48×48 pixels are obtained as LR images by random cropping. L1 loss is used as the loss function in our network; this function is optimized using the Adam algorithm.ResultWe compare our network with some traditional methods, such as bicubic interpolation, SRCNN, very deep super-resolution convolutional networks (VDSR), deep recursive residual networks (DRRN), residual dense networks (RDN), and RCAN. Five datasets, including Set5, Set14, Berkeley segmentation dataset(BSD)100, Urban100, and Manga109, are used as testsets to show the performance of the proposed method. Two indices, including peak signal-to-noise ratio (PSNR) and structural similarity (SSIM), are used to evaluate the reconstruction results of the proposed method and the other methods used for comparison. The average PSNR and SSIM values are obtained from the results of different methods on the five test datasets with different scale factors. Four test images with different scales are used to show the reconstruction results from using different methods. In addition, the proposed method is compared with enhanced deep residual networks (EDSR) in the convergence curve. Experiments show that the proposed method can recover more detailed information and clearer edges compared with most of the compared methods.ConclusionWe propose a hierarchical feature fusion attention network in this study. Such network can quickly recover high-frequency details with the help of the spatial attention module and the hierarchical feature fusion structure, thus obtaining reconstructed results that have a more detailed texture.关键词:super-resolution reconstruction;convolution neural network (CNN);hierarchical feature fusion;residual learning;attention mechanism211|144|11更新时间:2024-05-07
 -
 摘要:ObjectiveThe application of underwater video technology has a history of more than 60 years. This technology plays an important role in promoting research on marine bioecology, fish species, and underwater object detection and tracking. Video quality assessment is one of the key areas being studied in video technology research. Such assessment is especially vital for underwater videos because underwater environments are more complex than atmospheric ones. On the one hand, natural sunlight is seriously absorbed in deep water, and the artificial light used in video shooting suffers from light absorption, dispersion, and scattering due to water turbidity and submarine topography. As a result, underwater videos have blurred picture, low contrast, color cast, and uneven lighting. On the other hand, underwater video quality is affected by the limitation of photography equipment and the influence of water flow. When shooting a moving object, the lens hardly stabilizes and turns unsmooth. Compared with videos shot in natural scenes, underwater videos are characterized by large lens movement, shaking, and serious out of focus. These characteristics make it difficult for conventional video quality assessment(VQA) methods to evaluate underwater video accurately and effectively. Thus, the "quality" of underwater videos must be redefined, and an effective quality assessment method must be established. In this study, we establish an underwater video dataset by considering underwater video imaging characteristics, annotate its video quality via subjective quality assessment, and propose an objective underwater video quality assessment model on the basis of spatial naturalness and video compression index.MethodFirst, a new underwater video dataset is established to 1) collect several underwater videos captured in real deep sea environments for processing as source data; 2) filter these videos preliminarily to include different underwater scenes; 3) cut the preliminary screened videos at intervals of 10 seconds; 4) refilter the short video sequences to cover different shoot characteristics and color diversity, thus generating 25 video sequences with rich color information, different video contents, and different underwater video features; and 5) expand the dataset using different frame rates and bit rates as compression parameters. A total of 250 (25+25×3×3) video sequences are obtained. Then, subjective quality assessment is conducted. Absolute category rating is used by 20 participants to annotate all the 250 videos with scores ranging from 1 to 5. Then, we consider influences on the underwater video quality from the aspects of spatial, temporal, and compression features. The spatial features are expressed by natural scene statistics distortion characteristics in the spatial domain and are calculated using the blind/referenceless image spatial quality evaluator(BRISQUE) algorithm. The temporal features are expressed by optical flow motion features. We first compute the dense optical flow matrix between adjacent frames and then extract the mean and variation of overall optical flows and the mean and variation of the main objects in the video. Compression features use resolution, frame rate, and bit rate, which are easy-to-access video coding parameters. Considering the redundancy and relevancy of these potential features, we analyze the correlations among the features and between the features and the subjective quality scores. Then, we select 21 features as influence factors, which only contain 18 spatial natural characteristics and three compression indexes. Lastly, we establish a linear model with the selected features to evaluate underwater video quality objectively through linear regression with cross validation.ResultExperimental results show that the proposed underwater video quality assessment model based on spatial naturalness and compression index can obtain the highest correlation with subjective scores in comparison with several mainstream quality assessment models, including two underwater image quality indices (underwater image quality measure(UIQM) and underwater color image quality evaluation(UCIQE)), a natural image quality distortion index (BRISQUE), and a video quality assessment model (video intrinsic integrity and distortion evaluation oracle(VIIDEO)). Performance evaluation is based on Pearson's correlation coefficient (PCC), Spearman's rank order correlation coefficient (SROCC) and the mean squared errors (MSE) between the predicted video quality scores of each model and the subjective scores. On the test video dataset, our method achieves the highest correlation (PCC=0.840 8, SROCC=0.832 2) and a minimum MSE value of 0.113 1. This result indicates that our proposed method is more stable and can predict video quality more accurately than other methods. By contrast, the video quality assessment model VIIDEO can hardly provide correct results, whereas UIQM and UCIQE demonstrate poor performance with a PCC and SROCC of 0.3~0.4. In addition, BRISQUE performs relatively better than the other methods although still poorer than our method.ConclusionUnderwater videos are characterized by blurred picture, low contrast, color distortion, uneven lighting, large lens movement, and out of focus. To achieve an accurate assessment of underwater video quality, we fully consider the characteristics and shooting conditions of underwater videos and establish a labeled underwater video dataset with subjective video quality assessment. By fitting a linear regression model for subjective quality scores with natural statistical characteristics of video frames and video compression parameters, we propose an objective underwater video quality assessment model. The proposed nonreference underwater video quality assessment method is suitable to establish a prediction model that is highly related to human visual perception, with a small sample size of underwater video dataset.关键词:video quality assessment;objective quality assessment model;underwater video;natural scene statistics;compression parameters55|130|4更新时间:2024-05-07
Image Processing and Coding
-
 摘要:ObjectiveWith the development of the textile industry, the manual identification of cloth has been unable to meet the growing demand for production. More and more image recognition technologies are applied to cloth recognition. Image recognition is a technology that combines feature extraction and feature learning; it plays an important role in improving the competitiveness of the clothing industry. Compared with general-purpose images, cloth images usually only show subtle differences in texture and shape. Current clothing recognition algorithms are based on machine learning; that is, they learn the features of clothing images through machine learning and compare the features of known fabric to determine the clothing category. However, these clothing recognition algorithms usually have low recognition rates because they only consider the vision attribute, which cannot fully describe the fabric and ignores the properties of the fabric itself. Touch and vision are two important sensing modalities for humans, and they offer complementary information for sensing cloth. Machine learning can also benefit from such multimodal sensing ability. To solve the problem of low recognition accuracy of common fabrics, a fabric image recognition method based on fabric properties and tactile sensing is proposed.MethodThe proposed method involves four steps, including image measurement, tactile sensing, fabric learning, and fabric recognition. The main idea of the method is to use AlexNet to extract tactile image features adaptively and match the fabric properties extracted by MATLAB morphology. First, the geometric measurement method is established to measure the input fabric image samples, and a parametric model is obtained after quantitatively analyzing the three key factors by testing the recovery, stretching, and bending behavior of different real cloth samples. The geometric measures of fabric properties can be obtained through parametric modeling. Second, fabric tactile sensing is measured through tactile sensor settings, and the low-level features of tactile images are extracted using convolutional neural network (CNN). Third, the fabric identification model is trained by matching the fabric geometric measures with the extracted features of tactile image and parameter learning through the CNN to learn the different parameters of fabric properties. Finally, the fabric is recognized, and results are obtained. In this study, the issue on cloth recognition is addressed by the basis of tactile image and vision; in this manner, missing sensory information can be avoided. Furthermore, a new fusion method named deep maximum covariance analysis (DMCA) is utilized to learn a joint latent space for sharing features through vision and tactile sensing, which can match weak paired vision and tactile data. Considering that the current fabric dataset contains only a few fabric types, which cannot be classified as everyday fabric, two fabric sample datasets are constructed. The first is a fabric image dataset for fabric property measurement, including the recovery, stretching, and bending images of 12 kinds of fabric types, such as coarse cotton, fine cotton, and canvas. Each type of fabric has 10 images, thus having a total of 360 images. The second is a fabric tactile image dataset, which includes 12 fabric types, each comprising 500 images with a total of 6 000 images. The size of all images are set to 227×227 pixels for the convenience of the experiment.ResultTo verify the effectiveness of the proposed method, experiments are performed on 12 common fabric samples. Experimental results show that the recognition average accuracy can reach 89.5%. Compared with the method of using only a single and three kinds of fabric attributes, the proposed method obtains a higher recognition rate. The proposed method also possesses better recognition effect compared with that of the mainstream methods. For example, compared with recognition accuracy of sparse coding (SC) combined with support vector machine (SVM), that of the proposed method increases to 89.5%.ConclusionA fabric image recognition method of combining vision and tactile sensing is proposed. The method can accurately identify fabric for clothing and improve the accuracy of fabric recognition. For the feature extraction task, the AlexNet network achieves simplified high-dimensional features, which can adaptively extract effective features to avoid manual screening. Moreover, the DMCA model performs well in cross-modal matching. Compared with other clothing recognition methods, our method shows several advantages in terms of accuracy, without the cost of expensive equipment. However, our method does not consider the recognition accuracy problem, which is influenced by a small number of samples, a low image measurement data dimension, and a lack of tactile information. In the future, the issues to improve the recognition accuracy of various fabric types will be focused on further.关键词:cloth recognition;fabric properties;tactile sensing;convolutional neural network (CNN);parameter learning16|14|0更新时间:2024-05-07
 -
 摘要:ObjectiveBlurred car license plate recognition is a bottleneck in the field of license recognition. The development of deep learning brings a new research direction for license recognition. Benefitting from the superfeature extraction power of convolutional neural network (CNN) and the good context learning capacity of convolutional recurrent neural network (CRNN), the procedure of license recognition changes from a segmentation-based to an end-to-end method. Cur-rent deep learning-based license recognition methods suffer from two major problems. First, the size of the model is too large compared with traditional algorithms. In many applications, license recognition algorithms need to be deployed into embedded or mobile equipment. The generalization of algorithms is limited by its heavy size. Thus, keeping the balance between recognition efficiency and model size is challenging for license recognition methods based on deep learning. Second, the recognition effect of deep learning-based methods rely on large datasets, whereas the training dataset cannot be used widely because the car license formats vary in different countries. Collecting numerous car plate images manually is difficult in each country, let alone collecting blurred license images. Thus, the lack of training images is another challenge for deep learning-based license recognition methods. In this study, a lightweight car license plate recognition method is proposed. Car license plate images generated by optimized deep convolutional generative adversarial networks (DCGAN) are used to solve the problem of a lack of training dataset. The method simultaneously increases recognition accuracy and improves the generality of the model.MethodThe method includes two parts, namely, blurred car license image generation based on optimized DCGAN and lightweight car license plate recognition based on the depth of separable convolution networks with bidirectional long short-term memory (LSTM). In the first part, Wasserstein distance is used to optimize DCGAN and improve the diversity and stability of generated blurred images. Usually, generative adversarial networks (GAN) are designed to generate images with high quality; it is seldom used to generate images with low quality. Car license images are difficult to collect for format diversity and privacy reasons. In this study, GAN is used to generate images with low quality, that is, blurred car license images, to fill the training dataset and train deep models of license recognition. In the second part, a lightweight license recognition model is designed on the basis of deep separable convolution. Based on CRNN, the deep separable convolution operation can not only reduce the computation of recognition algorithms but also learn the features of training samples effectively. Lastly, the feature graphs are converted into feature sequences and input into bidirectional LSTM for sequence learning and labeling.ResultExperimental results show that the proposed method is effective. First, by adding the generated blurred license images of DCGAN into the training dataset, recognition accuracy can be improved effectively, not only for the proposed method but also for the traditional method and other deep learning-based methods. Using generated image is a feasible scheme for all kinds of methods to improve their recognition accuracy. Second, by combining deep separable convolution layers with CRNN, the size of the recognition model is reduced, and the computation speed is improved effectively; furthermore, recognition accuracy is guaranteed. The proposed lightweight blurred car plate recognition model has a similar recognition accuracy with CRNN-based methods after improving its performance by using generated images in this research. By contrast, the size and recognition speed of the model are better than those of the CRNN model. For the proposed method, the size and recognition speed of the model are 45 MB and 12.5 frame/s, respectively; for the CRNN-based method, the values are 82 MB and 7 frame/s, respectively. The high recognition accuracy and small size of the model improve its possibility for application into mobile or embedded equipment.ConclusionThe problem of lack blurred license images can be solved by using generated GAN images. Moreover, the lightweight license recognition model, which is improved with deep separable convolution, has high recognition accuracy and generalization performance.关键词:blur car license plate recognition;deep learning;generative adversarial network (GAN);deep separable convolution;convolutional recurrent neural network (CRNN)35|22|2更新时间:2024-05-07
 -
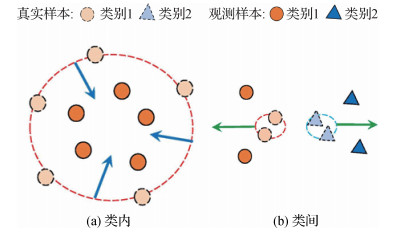 摘要:ObjectiveDistance metric learning, which is task dependent, is an essential research issue in machine learning and image processing. As a usual preprocessing step for classification and recognition, distance metric learning method enhances the performance of machine learning methods, such as clustering and k-nearest neighbor. This kind of method aims to learn the underlying structure of distribution given the semantic similarity or labels of samples. The optimization goal of distance metric learning is to shrink the distance between similar pairs and expand the distance between dissimilar pairs. With the development of machine learning, many distance metric learning methods have been proposed and applied successfully. These methods use L2 distance to measure loss. However, the L2 distance amplifies the influence of noise with the square operation, because of the unavoidable noise resulting from the complex application background. This situation may make the observed dissimilar and similar pairs respectively appear to be further apart and closer than in fact, which misleads the learning. Thus, the existence of noise leads to the poor performance of distance metric learning in machine learning and pattern recognition. Existing robust distance metric learning methods usually adopt L1 distance rather than L2 distance, aiming to diminish the distance scale of pairs simultaneously and thus reduce the influence of noise. However, by adopting a kind of loss for similar and dissimilar pairs, these methods neglect the different optimization directions between intra- and interclasses. Therefore, a robust distance metric learning algorithm based on L2/L1 loss with nongreedy solution is proposed. This method adopts more discriminative loss and improves the recognition performance in the presence of feature noise.MethodBased on marginal Fisher analysis (MFA) method, the proposed model adopts L2 and L1 distance to measure the loss of similar pairs and dissimilar pairs, respectively. In details, it considers the influence of noise on intraclass and interclass scatters separately. Affected by noise, the observed similar pairs may be closer than the truth, and the observed dissimilar pairs may be further apart than the truth, which may leads that the punishments on pairs is not enough. Adopting L2/L1 loss, L2 distance gives more punishments on similar samples than L1 distance does, and L1 distance gives more punishments on dissimilar samples than L2 distance does. However, the model is nonconvex, which is involved with both minimization of L2 norm and maximization of the L1 norm. Hence, the existing solution for trace ratio problems are not suitable for the objective function. This makes the object difficult to solve, thus a nongreedy solution is derived. First, the objective function, which is a ratio, is transformed into a difference of two convex functions during each iteration. This process makes the object easy to solve. Then, inspired by the idea of the difference of convex function algorithms (DCA), an iterative algorithm with nongreedy solution is derived to solve the object, and a projection matrix is learned. Analyzing the algorithm, in fact, an auxiliary function of the object is generated during the iteration, which makes sure that the value of objective function decreases. Lastly, a theoretical analysis of the iterative algorithm is performed to ensure the convergence of the proposal.ResultSynthetic experiments are conducted on five UCI(University of California Irrine) datasets and seven face datasets with noise. The nearest neighbor classifier based on the learned matrix is used to compare the performance of related methods. The proposed method outperforms other methods in terms of accuracy. First, when 5%, 15%, 25%, and 30% feature noise is added on five UCI datasets, MFA-L2/L1 achieves the best performance and exhibits robustness against noise. In addition, the accuracy of MFA-L2/L1 is 9% higher than the second-best method. Second, during the accuracy comparison with varying dimension of projection based on AR dataset, the proposal beats MFA, which validates that using the L1 loss for dissimilar pairs makes the proposal more discriminative. During the accuracy comparison with varying dimensions of projection based on FEI dataset, the proposal beats LDA-NgL1(non-greedy L1-norm liner discriminant analysis), which validates that using the L2 loss for similar pairs makes the proposal more discriminative. Lastly, based on five face datasets with noise, MFA-L2/L1 behaves better than other methods in terms of robustness.ConclusionThis study proposes a robust distance metric learning method based on L2/L1 loss, which adopts different losses for similar pairs and dissimilar pairs respectively. To solve a nonconvex object, the object is transformed into a difference of two convex functions during each iteration. By virtue of the idea of DCA, an iterative algorithm is derived, which generates an auxiliary function decreasing the object. The convergence of the algorithm is guaranteed by a theoretical proof. Based on the public datasets, several series of experiments with different levels and types of synthetic noise are executed. Results on different datasets show that the proposal performs well and is robust to noise based on the experiment datasets. Future research will focus on local distance metric learning in the presence of label noise, because the label noise makes the observed distribution deviate from the true distribution more than the feature noise does.关键词:distance metric learning;robustness;non-greedy algorithm;marginal Fisher analysis(MFA);classification and recognition;L2/L1 loss34|100|0更新时间:2024-05-07
 -
 摘要:ObjectiveSaliency detection is a technique that uses algorithms to simulate human visual characteristics. It aims to identify the most conspicuous objects or regions in an image and is used as a first step in image analysis and synthesis, allowing priority to be given to the allocation of computational resources in subsequent processing. The technique has been widely used in several visual applications, such as image segmentation of regions of interest, object recognition, image adaptive compression, and image retrieval. In most traditional methods, the basic unit of saliency detection is formed by image oversegmentation on the basis of regular regions, which are usually improved on n×n square blocks. Final saliency maps consist of these regions with their saliency scores, which result in the boundary block effect of the final saliency map. The performance of these models relies on whether the segmentation results fit the boundary of the salient object and the accuracy of feature extraction. By using this method, an improved effect can be obtained on the salient target with relatively regular structure and texture. However, in the real world, significant objects and backgrounds are often characterized by complex textures and irregular structure. These approaches cannot produce satisfactory results when images have complex textures, which yield low accuracy. To deal with the limitations of the past algorithms, we propose an algorithm for salient object detection based on irregular superpixels. This algorithm can consider the information of the structure and color features of the object and is closer to the object boundary to a certain extent, thus increasing the precision and recall rate.MethodIn the algorithm, the images to be inputted are first preprocessed by bilateral filtering and mean-shift in to reduce the scattered dots in the picture. Then in the RGB(red-green-blue) color space, the K-means algorithm is used to quantize the color of the image, and the color values of the cluster center and the cluster center are obtained and saved, in order to speed up the subsequent calculations. Then, according to the connected domain of the same color label, irregular pixel clusters are formed, in the meantime, set the center of the connected domain to the center of the location of the cluster, set the color corresponding to the color label of the connected domain to the color of the cluster. Next, for the contrast prior, the saliency scores of the image pixel cluster is determined by the color statistic information of the input image. In particular, the saliency scores of a pixel cluster is defined by its color contrast with all other pixel clusters in the image, the size of the pixel cluster and the probability of the corresponding color appearing in the picture. For the central prior graph, the center of the significant target is first estimated by the target coarse positioning method. Then, on the basis of the distance between clusters and the center, the saliency scores of each pixel cluster can be calculated; thus, the central prior graph can be formed. The contrast prior graph is then combined with the central prior graph to obtain an initial saliency map. Lastly, to make the salient map highlight the significant target prominently, a graph model and morphological changes are introduced in saliency detection due to their outstanding performance in image segmentation tasks. In this manner, the final saliency map is obtained.ResultTo test the recognition effect of the proposed algorithm, we compare our model with five excellent saliency models on two public datasets, namely, DUT-OMRON(Dalian University of Technology and OMRON Corporation) and Microsoft Research Asia(MSRA) salient object database. The quantitative evaluation metrics contain F-measure and precision-recall(PR) curves. We provide several saliency maps of each method for comparison. Experiment results show that the algorithm proposed in this study has a greater performance improvement compared with the previous algorithms; it also has a better visual effect in the MSRA and DUT-OMRON datasets. The saliency maps show that our model can produce refined results. Compared with the detection results in frequency-tuned salient region detection(FT), luminance contrast(LC), histogram based contrast(HC), region based contrast(RC), and minimum barrier salient object detection(MB) in MSRA, the F-measure (higher is better) increases by 47.37%, 61.29%, 31.05%, 2.73%, and 5.54%, respectively. Compared with DUT-OMRON, the F-measure increases by 75.40%, 92.10%, 63.50%, 8.83%, and 16.34%, respectively. Comparative experiments demonstrate that the fusion algorithm improves saliency detection. In addition, a series of comparative experiments in MSRA are conducted to show the preponderance of our algorithm.ConclusionIn this study, a saliency recognition algorithm based on irregular pixel blocks is proposed. The algorithm is divided into three parts: irregular pixel blocks, which are constructed by using the color information of images; initial saliency graph, which is obtained by fusing contrast prior and center prior; The final saliency map is obtained by improving the initial saliency map using a graph model. Experimental results show that our model improves recognition performance and outperforms several best performing saliency approaches.关键词:significance detection;irregular block;color space quantization;global contrast;center prior73|111|1更新时间:2024-05-07
 -
 摘要:ObjectiveImage segmentation is the foundation of object-based image analysis (OBIA). Scale set model is an effective image multiscale segmentation model,which can obtain the multiscale expression of images. However,traditional scale set models have several problems,such as low efficiency,complex data structure,and numerous redundant scales. To solve these problems,this study proposes a sparse scale set model based on the global regional dissimilarity threshold sequence.MethodThe building of the sparse scale set model is driven by a global regional dissimilarity threshold. Specifically,the sparse scale sets are established by repeatedly expanding the global regional dissimilarity threshold and merging all adjacent regions whose dissimilarity is less than the global regional dissimilarity threshold. In addition,the global regional dissimilarity threshold corresponds to the abstract scale. Moreover,many key problems in the building of sparse scale sets are solved. First,a memorized deep-first search is adopted to obtain adjacent regions whose dissimilarity is less than the global regional dissimilarity threshold in the region adjacency graph (RAG). This process remarkably improves the search efficiency. Second,the true value of the total number of regional mergers corresponding to each scale can be obtained,whereas the accurate functional relationship between the total number of regional mergers and the global regional dissimilarity threshold cannot be obtained; therefore,the global regional dissimilarity threshold for each scale is sequentially obtained by repeatedly predicting the global regional dissimilarity threshold,and then the actual global regional dissimilarity threshold is backstepped on the basis of the actual number of merged regions and the expected number of merged regions. A three-dimensional exponential smoothing method that can achieve a stable number of merged regions between adjacent scales is used by the prediction algorithm of the global regional dissimilarity threshold. Third,the value of the global regional dissimilarity threshold rapidly expands because large scales forcefully merge large dissimilarities of adjacent regions,causing prediction lag. Therefore,this study uses a scale attribute analysis based on local variance (LV) and Moran's index (MI) to stop merging when the image segmentation state reaches undersegmentation.ResultFour experiments are designed to investigate the influence of sparsity on regional merge quality,the control of merging stop scale,the influence of core parameters on the speed of sparse scale set building,and the comparison of the speed of sparse and traditional scale set building. In the experiment on the influence of sparsity on regional merge quality,the values of LV and MI during the traditional scale set merging are used as standard values because traditional scale sets follow the optimal merge criterion. Results show that the root mean square error(RMSE) of LV and MI are only 0.037 and 0.434,respectively,even though the sparsity is expanded to 0.3. We believe that the degree of dissimilarity between the adjacent regions formed by oversegmentation within the same feature is usually much smaller than that between the adjacent regions belonging to different features. Therefore,increasing sparsity does not reduce the quality of the regional merger. The effectiveness of the proposed method based on scale attribute analysis is verified by a merging stop scale control experiment. The scale of the merging stop can be controlled by modifying the value of the penalty factor Q; the smaller the value of Q,the larger the scale of the merging stop. The results of many experiments reveal that the empirical value of Q is 0.6 because the probability of the merging stop scale is large enough to fall in a reasonable undersegmentation scale. The experiment on the influence of core parameters on the speed of sparse scale set building verifies the effect of different values of sparsity d on the building time of the sparse scale sets when N is fixed in the experiment. The building time is divided into two parts: region merger and scale attribute calculation. With the increase in d,the time of region merging and scale attribute calculation decrease. The scale attribute calculation time has a linear decreasing relationship with the reciprocal of d. Specifically,when d=0.017,the number of merged regions between adjacent scales is 50,the total number of theoretical scales is 61,and the total construction time is 22.082 s. When d=0.2,the number of merged regions between adjacent scales is 600,the total number of theoretical scales is 6,and the total build time is only 6.414 s. The smaller the value of d,the smaller the global regional dissimilarity threshold difference between adjacent scales; thus,edges that meet the conditions in RAG become more difficult to retrieve. The time consumption of each scale attribute calculation is only related to the image itself. The scale attribute calculation time of each scale in the experimental image is approximately 0.2 s. The smaller the value of d,the more the intermediate scales,resulting in the time consumption of the scale attribute calculation. In the comparison of the speed of sparse and traditional scale set building,the time for sparse scale set region merging increases from 0.318 s to 9.207 s,whereas the time for calculating the scale attribute remains basically unchanged when the sparsity d of the sparse scale sets is fixed,and the number of initial image segmentation regions N increases from 500 to 3 000. The total building time of the sparse scale sets increases from 4.513 s to 13.521 s,whereas the building time of the traditional scale sets increases from 12.661 s to 37.706 s. The average building speed of the sparse scale sets in the experiment is 3.11 times of the traditional scale sets.ConclusionIn this study,a sparse scale set model based on the global regional dissimilarity threshold sequence is proposed; the implementation method is presented,and several key problems are solved. Experiment results indicate that the sparse scale set model can dramatically improve the speed of scale set model building without reducing the quality of the merger. Furthermore,the sparse scale set model is more widely and flexibly applied in comparison with the traditional scale set model.关键词:scale set model;multi-scale segmentation;region merging;scale attribute analysis;object-based image analysis(OBIA)50|184|1更新时间:2024-05-07
Image Analysis and Recognition
-
 摘要:ObjectiveWith the continuous development and popularization of robotics and autonomous driving technology, the demand for high-precision localization and navigation in dynamic scenarios continues to increase. Visual localization only requires a common camera to achieve a localization function with considerable accuracy, and the obtained video data can be used for 3D scene reconstruction, scene analysis, target recognition, target tracking, and other tasks. Among these tasks, visual odometry (VO) has become a hotspot in autonomous localization research and has been widely applied in the localization and navigation of robots and unmanned vehicles. VO can estimate the camera pose relative to a static background. However, the current research and application of VO are based on static scenes where most objects are stationary. When multiple moving targets are present in a scene, the camera ego-motion generates a large error. Therefore, eliminating the interference of moving targets in a scene (even though they occupy most of the field of view), accurately calculating the camera pose, and estimating the motion model of each moving object are practical problems that need to be solved in moving target trajectory estimation and modeling analysis.MethodThis paper proposes a multi-motion VO based on split and merged motion segmentation that applies the general method for estimating the motion model parameters based on traditional VO. We also apply the multi-model fitting method on multiple data in the motion estimation process. The motion model is estimated to fit multiple motion model parameter instances. Afterward, multiple motion models are mapped in time series to complete a continuous frame motion segmentation, and the absolute pose of each moving target at the current time is obtained. Local bundle adjustment is then applied to directly correct the camera and absolute poses of each moving target and to complete the multi-motion VO process. The main contents and innovations of this article are summarized as follows:1) the motion segmentation method based on multi-model fitting is applied to the traditional VO framework, and a multi-motion VO framework based on multi-model fitting motion segmentation is proposed. In a dynamic scene with multiple moving rigid body targets, the trajectory of multiple moving objects and the ego-motion of the camera are simultaneously estimated. 2) This paper combines multi-model fitting with VO. The preference analysis method of quantized residuals is also combined with alternating sampling and clustering strategies to improve the performance of the existing multi-model fitting method in segmenting the motion and dynamic object motion models of the camera in dynamic scenes.3) In this paper, the motion segmentation strategy is optimized through motion segmentation to achieve a continuous frame motion segmentation and to obtain multi-motion model parameters. Furthermore, the absolute pose of multi-motion targets (including camera motion) in the same coordinate system can be obtained to realize a complete multi-motion VO.First, the oriented feature from aclelerated segments test(FAST) and rotated binary robust independent elementary features(BRIEF) (ORB) method was used to extract the feature points of the stereo images of the current and previous frames, and then a stereo matching of the left and right images of these frames was performed by matching the feature points of these images and obtaining the associated 3D information in the current and previous frames. Second, the preference analysis method of quantized residuals was combined with alternating sampling and clustering strategies to improve the existing multi-model fitting method, and an inlier segmentation of the current frame multi-motion model was performed to achieve a single-step motion segmentation. Third, a continuous frame motion segmentation was performed based on the results of the multi-motion segmentation at the previous moment. Fourth, based on the ego-motion estimation results obtained by a camera in each moment and the estimation results for other moving targets in a scene, the inliers of multiple target movement models in a scene at each moment were obtained as a time series. Fifth, by using the inliers of each motion model obtained via motion segmentation, random sample consonsus(RANSAC) robustness was used to estimate the motion parameters of each model, and the motion results of the camera relative to each motion target were estimated. Sixth, the estimation result was converted into a unified global coordinate to determine the absolute pose of each moving target at the current time. Finally, local bundle adjustment was used to directly correct the camera pose and the absolute pose of each moving target in each moment. The inliers of the camera motion model and the motion parameters of multiple motion models across various periods were used to optimize the trajectories of multiple moving targets.ResultCompared with the existing methods, the proposed continuous frame motion segmentation method can achieve better segmentation results, show higher robustness and continuous frame segmentation accuracy, and guarantee an accurate estimation of each motion model parameter. The proposed multi-motion VO method not only effectively estimates the pose of the camera but also that of a moving target in a scene. The results for the self-localization of the camera and the localization of the moving target show small errors.ConclusionThe proposed multi-motion VO method based on the split-merged motion segmentation method can simultaneously segment the motion model of the camera in dynamic scenes and the moving object motion models. The absolute motion trajectories of the camera and various moving objects can also be estimated simultaneously to build a multi-motion VO process.关键词:multi-motion visual odometry;multi-model fitting;motion segmentation;quantization of residual preferences;alternating sampling and clustering59|103|0更新时间:2024-05-07
 -
 摘要:ObjectivePedestrian tracking and first-person vision are challenging tasks in the field of computer vision. First-person vision focuses on analyzing and processing first-person videos, thus helping camera wearers make the right decisions. Its particularities include the following: First, the foreground and background of the video are difficult to distinguish because the camera is always moving. Second, the shooting location of the video is not fixed, and the lighting changes considerably. Third, the shooting needs to have real-time processing capabilities. Fourth, it also needs to have embedded processing capabilities when considering application to smart glasses and other devices. The above problems can cause pedestrian occlusion problems and collision avoidance behavior, thus leading to low tracking efficiency and accuracy. Therefore, this study proposes a social force-optimized multipedestrian tracking algorithm in first-person videos to resolve frequent occlusions and collisions, thereby improving tracking efficiency and accuracy.MethodWe use a detection-based tracking algorithm, which simplifies tracking problems into detected target matching problems. After initial tracking, the social force model is used to optimize frequent occlusion and collision avoidance behavior. The feature extraction strategy of the single shot multi-box detector (SSD) algorithm is first adjusted, and the features from low-level feature maps, such as conv4_3, conv6_1, conv6_2, conv7_1, conv7_2, conv8_2, and conv9_2, are extracted. Then, the idea of a dense and residual connection of DenseNet is drawn. In order to realize the repeated use of features, we perform a union operation on the input and output of conv6_2, and input it to conv7_2. Then, the aspect ratio of the default box is reset, and the default frame is simplified to an aspect ratio of 0.41 on the basis of the Caltech large pedestrian dataset. These steps are performed to simplify calculations and reduce the interference in pedestrian detection. From the large-scale ReID dataset, the apparent features of pedestrians are extracted on the basis of a convolutional neural network model by adding two convolutional layers, a maximum pooling layer, and six remaining modules to the pretrained network; as a result, a wide residual network is constructed. The network model is used to extract the apparent features of the pedestrian target boxes. The preliminary pedestrian tracking results are obtained by calculating the similarity of pedestrian features. First, the degree of location matching is calculated, followed by the calculation of the apparent feature matching and the degree of fusion matching. The Kuhn-Munkres algorithm is used to perform the matching correlation of the detection results. Lastly, the idea of a social force model is introduced to optimize the preliminary tracking results. The first step is to define the grouping behavior of pedestrians. Then, the grouping of each pedestrian tracking target is calculated, and a grouping identifier is added. In the case of occlusion, pedestrians in the same group are still accurately tracked by maintaining the group identification. The second step is to define the pedestrian domain and calculate the exclusion of pedestrian groups that cross the domain. After the occurrence of collision avoidance behavior, the tracking target boxes also closely follow the pedestrian target.ResultCompared with other tracking algorithms on the six first-person video sequences of the public datasets eidgenössische technische hochschule (ETH), multi-object tracking 16 (MOT16), and adelaide (ADL), the algorithm runs at a near real-time speed of 20.8 frames per second, and the multiple object tracking accuracy (MOTA) is improved by 2.5%. Among the six tracking indicators, four obtained the optimum results, whereas two obtained suboptimal results. Among them, lifted multicut and person (LMP_p) obtained the best performance on the mostly tracked (MT) indicator, but it was achieved under the premise of loss of operating efficiency. Simple online and realtime tracking (SORT) performed well on the Hz index, but its other performance indicators are average. In the comparison experiment of operating efficiency, the running speed of the method in this study reaches approximately 20 frames per second on six datasets, and its operating efficiency reaches quasi real-time performance, which is second only to the SORT method. However, SORT comes at the expense of accuracy in exchange for operating efficiency, thus often causing problems, such as tracking failure.ConclusionThis study explores several issues of first-person pedestrian tracking and proposes social force-optimized multipedestrian tracking in first-person videos. The core idea of this method is to simplify the tracking problem into a matching problem of detection results, use a single-shot multibox detector SSD to detect pedestrians, and then extract the apparent characteristics of pedestrians as the main basis for data association. The social force model is used for optimization to solve the tracking problem caused by frequent occlusion and collision avoidance. Moreover, this model performs well in problems, such as difficulty in distinguishing the foreground and background, unobtrusive features, numerous pedestrian targets, and lighting changes. Experimental results based on numerous first-person video sequences show that compared with the existing mainstream universal tracking methods, the proposed method have higher tracking accuracy and better real-time effect. These results validate the effectiveness of the proposed method in multipedestrian tracking in first-person videos.关键词:first-person video;multi-pedestrian tracking;social force optimized;collision avoidance;grouping behavior37|21|0更新时间:2024-05-07
 -
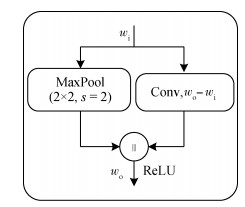 摘要:ObjectiveIn a real-time driving process, the vehicle must be positioned to complete the basic tasks of horizontal and vertical control. The premise of vehicle positioning problems is to understand road information. Road information includes all kinds of traffic signs, among which lane line is an important pavement information in the road scene. Such information is crucial for lane maintenancing, departure warning, and path planning; it is also important in research on advanced driving assistance systems. Therefore, lane line detection has become an important topic in real-time vehicle driving. Road scene images can be obtained using a vehicle camera, lidar, and other equipments, thus making it easy to obtain lane line images. However, lane line detection suffers from some difficulties. Traditional lane line detection methods usually design features manually. Starting from the bottom features, such as color, brightness, shape, and gray level, the method involves image processing via denoising, binarization, and graying. Then, the lane line features are extracted by combining edge detection, Hough transform, color threshold setting, perspective transform, and other methods. Afterward, the lane lines are fitted by straight or curve line models. These methods are simple and easy to implement, but the accuracy of lane line detection is poor under the influence of multiscene environment conditions, such as object occlusion, light change, and shadow interference; moreover, the manual design of features is time consuming and thus cannot meet the real-time requirements of vehicle driving. To solve these problems, this study proposes a lane detection model named efficient residual factorized network-auxiliary loss(ERFNet-AL), which embeds an auxiliary loss.MethodThe model improves the semantic segmentation network of ERFNet. After the encoder of ERFNet, a lane prediction branch and an auxiliary training branch are added to make the decoding phase parallel with the lane prediction and auxiliary training branches. After the convolution layer of the auxiliary training branch, bilinear interpolation is used to match the resolution of input images to classify four lane lines and the background of images. The training set images in the dataset are sent to the lane line detection model after preprocessing, such as clipping, rotating, scaling, and normalization. The features are extracted through the semantic segmentation network ERFNet, thereby obtaining the probability distribution of each lane line. The auxiliary training branch uses a convolution operation to extract features, and bilinear interpolation is used to replace the deconvolution layer after the convolution layer to match the resolution of the input images and classify the four lane lines and background. After using convolution, batch normalization, dropout layers, and other operations, the lane line prediction branch predicts the existence of lane lines or virtual lane lines and outputs the probability value of lane line classification. An output probability value greater than 0.5 indicates the existence of lane lines. If at least one lane line exists, then a probability distribution map of the corresponding lane lines must be determined. On the probability distribution map of each lane line, the coordinates of the largest point with a probability greater than a specific threshold is identified by row, and the corresponding coordinate points is selected in accordance with the rules of selecting points in the SCNN (spatial convolutional neural network) model. If the number of points found are greater than 2, then these points are connected to form a fitted lane line. Then, the cross-entropy loss between the predicted value of the auxiliary training branch output and the real label is calculated and used as the auxiliary loss. The weight of all four lane lines is 1, and the weight of the background is 0.4. The auxiliary, semantic segmentation, and lane prediction losses are weighted and summed in accordance with a certain weight, and the network parameters are adjusted via backpropagation. Among them, the total loss includes the main, auxiliary, and lane prediction losses. During training, the weights of ERFNet on the Cityscapes dataset are used as pretraining weights. During training, the model with the largest mean intersection over union is taken as the best model.ResultAfter testing in nine scenarios of the CULane public dataset, the F1 index of the model in the normal scenario is found to be 91.85%, which is a 1.25% increase compared with that of the SCNN model (90.6%). Moreover, the F1 index in seven scenes, including crowded, night, no line, shadow, arrow, dazzle light, and curve scenarios, is increased by 1%~7%; the total average F1 value in nine scenarios is 73.76%, which is 1.96% higher than the best ResNet-101-self-attention distillation (SAD) model; the average run time of each image is 11.1 ms, which is 11 times shorter than the average running time of the spatial CNN model when tested on a single GPU of GeForce GTX 1 080; the parameter quantity of the model is only 2.49 MB, which is 7.3 times less than that of the SCNN model. On the CULane dataset, ENet with SAD is the lane line detection model with the shortest average run time of a single-image test. The average run time of this model is 13.4 ms, whereas that of our model is 11.1 ms. Compared with ENet with SAD, the average running time is reduced by 2.3 ms. When detecting lane lines at a crossroad scenario, the number of false positive is large, which may be due to the large number of lane lines at crossroads, whereas only four lane lines are detected in our experiment.ConclusionIn various complex scenarios, such as object occlusion, lighting changes, and shadow interference, the model is minimally affected by the environment for real-time driving vehicles, and its accuracy and real-time performance are improved. The next work will aim to increase the number of lane lines, optimize the model, and improve the model's detection performance at crossroads.关键词:multi-scenario lane line detection;semantic segmentation network;auxiliary loss;gradient disappear;CULane dataset43|22|1更新时间:2024-05-07
Image Understanding and Computer Vision
-
 摘要:ObjectiveFractals have been widely used in image processing, signal processing, physics, biology, system science, medicine, geography, material science, and architecture. Fractals have also become an important tool to describe and study complex and irregular geometric features quantitatively. Fractal dimensions are formally defined as the Hausdorff-Besicovitch dimension. However, estimating fractal dimensions can be conducted in several ways, each of which uses a slightly different definition of the dimension. A few of these methods include the box-counting method (BCM), wavelet transform, power spectrum (using the Fourier transform), Hurst coefficient, Bouligand-Minkowski, variation, and capacity dimension methods. Given its high efficiency and easy implementation, BCM has become a widely used method to calculate the fractal dimension of binary images. However, BCM is influenced by many factors, such as range of box sizes, selection of fitting points for calculation, method of box covering, and rotation angle of the image, which lead to the instability of the box-counting dimension. Among the factors that affect the box dimension, the box-counting dimension of binary images change greatly due to image rotation and then leads to the deviation of the box-counting dimension. When the image has rotation, the box dimension calculated by the BCM method is usually smaller than the theoretical fractal dimension. The traditional method (BCM) only has a good estimation of nonrotating images. The estimation of rotating images deviates greatly when the traditional method is used and leads to the large difference in the box-counting dimension of the binary image with different rotating angles of the same object. The average deviation of the box-counting dimension caused by rotation is 3%~5%, and the maximum deviation can reach approximately 8%. To reduce the influence of the image's rotation on the box-counting dimension, the rotation angle of the image must become 0. If the binary image is directly rotated, then the new binary image generated after rotation is inevitably accompanied by interpolation. Although the rotation of the image is corrected, it also causes image deformation and deviation of the box-counting dimension. To avoid rotating the binary images directly, this study proposes a new method to calculate the fractal dimension of binary images.MethodBCM is mostly used to calculate the box-counting dimension of bitmap because the bitmap is relatively easy to obtain, and the box-counting method of vector graphs is rarely studied. Vector graphics have more advantages compared with bitmaps because binary images cannot avoid the thickness problem caused by the pixel size and the interpolation problem caused by the bitmap image rotation. On the contrary, vector images are characterized by no thickness and easy rotation without interpolation. Based on these characteristics, this study proposes a new method called skeleton rotating method to calculate the box-counting dimension. The innovation of this method is the conversion of the binary image into a vector graph and the calculation of the box-counting dimension on the basis of the vector graph. This method mainly includes the following steps: First, the central point of the pixel point of the binary image is regarded as a series of points on the plane. Lines are used to connect the adjacent points on the plane to form a skeleton (vector graph) of the binary image. Then, the minimum containing the rectangle and rotation angle θ of the skeleton are calculated using the genetic algorithm. To ensure the accuracy of the calculation results, the genetic algorithm parameters are set as follows: initial number of population, 100; mutation probability of offspring, 0.1; total generations of reproduction, 10 000. Next, the skeleton is rotated by the angle θ to obtain a nonrotating vector graph, and the skeleton is covered with boxes of different sizes in a suitable range of box sizes. Simultaneously, we need to record the number of boxes covered with different sizes and the size of the boxes when covering the skeleton to obtain multiple fitting points (-ln r, ln Nr). Lastly, the fitting points are fitted in accordance with the least squares method to obtain the box-counting dimension.ResultIn order to compare skeleton rotating method more comprehensively, this paper analyzes and verifies the self-similar image, character scanning image and plant image. In the self-similar image, three different types of self-similar fractal image are calculated (each type contains 45 images with different rotation angles). Compared with the BCM method, the average fitting error (least square fitting error) of the skeleton rotating method was reduced by 0.725 2%, 3.060 5% and 2.298 5% respectively, while the variation range (the difference between the maximum and minimum calculated value) decreased by 0.057 3, 0.088 3 and 0.085 9, respectively. In the character scanning image, compared with the BCM, the change range of the box dimension of the character scanning image is reduced by 0.012 75 and the average fitting error is reduced by 0.001 28. In the plant image, compared with the BCM, the change of box dimension is reduced by 0.017 04 and the average fitting error is reduced by 0.000 5.ConclusionThe skeleton rotating method converts the binary image into a vector graph on which the estimation of the box-counting dimension is based. The vector graph is used as a basis because it is convenient to rotate and has no thickness. When the vector graph is used for estimating the box-counting dimension, the interpolation problem caused by the rotation of the binary image is avoided, and the influence of the rotation of the binary image on the box-counting dimension is reduced. The results of the skeleton rotating method are better than that of the BCM.关键词:fractal dimension;box-counting method(BCM);skeleton rotating method;vector image;binary image23|37|0更新时间:2024-05-07
 -
 摘要:ObjectiveThe theoretical research and application of fractal geometry is continuously making progress. Traditional methods are formed in the spatial domain through iterative operations on generators. To extend the fractal generation method, we introduce the spectrum analysis method into fractal geometry. In signal processing tasks, such as filtering, data compression, model editing, and object retrieval, the spectrum analysis method has been widely and successfully applied, especially in the field of computer-generated fractals. However, spectrum analysis based on orthogonal transform is rarely studied in fractal generation and analysis. One reason is the lack of a suitable orthogonal function system. We should choose to express the fractal accurately with a few orthogonal basis functions. Polygonal fractal curves should be chosen as orthogonal expressions of the same type of orthogonal function systems. From the point of view of the spline function, the polyline is a linear spline function. Therefore, we make a fractal curve on the basis of a class of one-time orthogonal spline function system (Franklin function) to obtain the Franklin spectrum. Compared with other orthogonal function systems, the Franklin spectrum has inherent advantages in the expression and generation of fractal curves.MethodWe first show the orthogonal decomposition and reconstruction algorithm of fractal curves under the Franklin function system. Then, with the classic von Koch snowflake curve taken as an example, the Fourier series, the V system, and the Franklin orthogonal system are compared to express the fractal curve. Lastly, the Franklin spectrum is modified, and then orthogonal reconstruction is performed to generate rich and diverse fractal curves. The advantages and characteristics of this method are compared and demonstrated. The traditional generator iteration is a process-based fractal expression method, but we express the fractal from the perspective of spectrum, which is the essential difference. One of the fundamental core issues of spectrum analysis is the choice of orthogonal function systems. Considering that the fractal curve is a continuous and unsmooth polyline type, the traditional orthogonal function system has the following two problems. On the one hand, the usual trigonometric functions (Fourier transform) and wavelet transform are only suitable for smooth objects. On the other hand, the orthogonal piecewise polynomial function system represented by the V system is suitable for continuous and discontinuous objects. Neither method is suitable for fractal spectrum analysis. Therefore, this study introduces a type of continuous orthogonal function system, i.e., the Franklin function system. Through the orthogonal decomposition of fractal curves, the corresponding Franklin spectrum is obtained.ResultWe take a typical typing curve, i.e., the von Koch curve, as an example and use the Fourier and Franklin methods to perform orthogonal decomposition and reconstruction. The characteristics of the fractal curve expression algorithm based on the Franklin function are verified. Moreover, compared with other orthogonal function systems, it emphasizes the advantage of the Franklin function system in the frequency domain representation of fractal curves. Based on the von Koch curve, Sierpinski square curve, and Hilbert curve, we use different resolutions and parameters to conduct comparative experiments. The experiments verify the superiority of the Franklin function system in the frequency domain expression of fractal curves. By freely adjusting the Franklin spectrum, many new fractal curves with different shapes can be easily generated. According to the properties of the Franklin function system (orthogonality and multiresolution), the Franklin spectrum describes the fractal curve from the frequency domain perspective and achieves the optimum multilevel hierarchical approximation of the entire fractal curve. Low-frequency components focus on the contour information of the fractal curve, whereas high-frequency components describe its detailed information. When the Franklin spectral coefficient reaches 2n+1 terms, an accurate reconstruction of the fractal curve can be achieved; ordinary orthogonal function systems cannot achieve such accuracy.ConclusionWe take the fractal curves of the study as an example. Classical fractal objects, such as von Koch snowflake, Siepinski carpet, and Hilbert curve, have an infinitely small-scale hierarchical structure. However, when they are stored in a computer and drawn, they can only present approximation results within a certain scale. Therefore, they are continuous but unsmooth polylines. Afterward, choosing Franklin orthogonal function systems can make proper orthogonal expressions for such objects. The Franklin function can be accurately expressed with limited orthogonal basis functions. On the one hand, Franklin functions are not smooth functions and thus can express fractal graphs well with polyline segments. On the other hand, Franklin functions are not discontinuous orthogonal function systems, and continuous functions can be expressed with a few term basis functions. This expression does not have fragility; in other words, the fractal orthogonal expression using the Franklin function does not distort the fractal curve. In general, the Franklin spectrum can not only achieve limited and accurate reconstruction of fractal curves but also describe the morphological characteristics of fractals on different scales. The fractal generation method based on Franklin spectrum adjustment provides new ideas and solutions for fractal generation.关键词:fractal curve;orthogonal system;Franklin functions;spectrum analysis;multi-resolutions24|24|1更新时间:2024-05-07
Computer Graphics
-
 摘要:ObjectiveGlaucoma and pathologic myopia are two important causes of irreversible damage to vision. The early detection of these diseases is crucial for subsequent treatment. The optic disk, which is the starting point of blood vessel convergence, is approximately elliptical in normal fundus images. An accurate and automatic segmentation of the optic disk from fundus images is a basic task. Doctors often diagnose eye diseases on the basis of the colored fundus images of patients. Browsing the images repeatedly to make appropriate diagnoses is a tedious and arduous task for doctors. Doctors are likely to miss some subtle changes in the image when they are tired, resulting in missed diagnoses. Therefore, using computers to segment optic disks automatically can help doctors in the diagnosis of these diseases. Glaucoma, pathologic myopia, and other eye diseases can be reflected by the shape of the optic disk; thus, an accurate segmentation of the optic disk can assist doctors in diagnosis. However, achieving an accurate segmentation of optic disks is challenging due to the complexity of fundus images. Many existing methods based on deep learning are susceptible to pathologic regions. UNet has been widely used in medical image segmentation tasks; however, it performs poorly in optic disk segmentation. Convolution is the core of convolutional neural networks. The importance of information contained in different spatial locations and channels varies. Attention mechanisms have received increasing attention over the past few years. In this study, we present a new automatic optic disk segmentation network based on UNet to improve segmentation accuracy.MethodAccording to the design idea of UNet, the proposed model consists of an encoder and a decoder, which can achieve end-to-end training. The ability of the encoder to extract discriminative representations directly affects the segmentation performance. Achieving pixel-wise label data is expensive, especially in the field of medical image analysis; thus, transfer learning is adopted to train the model. Given that ResNet has a strong feature extraction capability, the encoder adopts a modified and pretrained ResNet34 as the backbone to achieve hierarchical features and then integrates a squeeze-and-excitation (SE) block into appropriate positions to enhance the performance further. The final average pooling layer and the fully connected layer of ResNet34 are removed, but the rest are kept. The SE block can boost feature discriminability, which includes SE operations. The SE block can model the relationship between different feature map channels to recalibrate channel-wise feature responses adaptively. In the encoder, all modules, except for four SE blocks, use the pretrained weights on ImageNet (ImageNet Large-Scale Visual Recognition Challenge) as initialization, thereby speeding up convergence and preventing overfitting. The input images are downsampled for a total of five times to extract abstract semantic features. In the decoder, 2×2 deconvolution with stride 2 is used for upsampling. Five upsampling operations are conducted. In contrast to the original UNet decoder, each deconvolution, except for the last one, outputs a feature map of 128 channels, thus reducing model parameters. The shallow feature map preserves more detailed spatial information, whereas the deep feature map has more high-level semantic information. A set of downsampling layers enlarges the receptive field of the network but causes a loss of detailed location information. The skip connection between the encoder and decoder can combine high-level semantic information with low-level detailed information for fine-grained segmentation. The feature map in the encoder first goes through a 1×1 convolution layer, and then the output of 1×1 convolution is concatenated with the corresponding feature map in the decoder. Using skip connection is crucial in restoring image details in the decoder layers. Lastly, the network outputs a two-channel probability map for the background and the optic disk; this map has the same size as the input image. The network utilizes the last deconvolution with two output channels, followed by SoftMax activation, to generate the final probability map of the background and the optic disk simultaneously. The segmentation map predicted by the network is rough; thus, postprocessing is used to reduce false positives. In addition, DiceLoss is used to replace the traditional cross entropy loss function. Considering that the training images are limited, we first perform data augmentation, including random horizontal, vertical, and diagonal flips, to prevent overfitting. An NVidia GeForce GTX 1080Ti device is used to accelerate network training. We adopt Adam optimization with an initial learning rate of 0.001.ResultTo verify the effectiveness of our method, we conduct experiments on four public datasets, namely, RIM-ONE (retinal image database for optic nerve evaluation)-R1, ONE-R1, RIM-ONE-R3, Drishti-GS1, and iChallenge-PM. Two evaluation metrics, namely, F score and overlap rate, are computed. We also provide some segmentation results to compare different methods visually. The extensive experiments demonstrate that our method outperforms several other deep learning-based methods, such as UNet, DRIU, DeepDisc, and CE-Net, on four public datasets. In addition, the visual segmentation results produced by our method are more similar to the ground truth label. Compared with the UNet results in RIM-ONE-R1, RIM-ONE-R3, Drishti-GS1, and iChallenge-PM, the F score (higher is better) increases by 2.89%, 1.5%, 1.65%, and 3.59%, and the overlap rate (higher is better) increases by 5.17%, 2.78%, 3.04%, and 6.22%, respectively. Compared with the DRIU results in RIM-ONE-R1, RIM-ONE-R3, Drishti-GS1, and iChallenge-PM, the F score (higher is better) increases by 1.89%, 1.85%, 1.14%, and 2.01%, and the overlap rate (higher is better) increases by 3.41%, 3.42%, 2.1%, and 3.53%, respec tively. Compared with the DeepDisc results in RIM-ONE-R1, RIM-ONE-R3, Drishti-GS1, and iChallenge-PM, the F score (higher is better) increases by 0.24%, 0.01%, 0.18%, and 1.44%, and the overlap rate (higher is better) increases by 0.42%, 0.01%, 0.33%, and 2.55%, respectively. Compared with the CE-Net results in RIM-ONE-R1, RIM-ONE-R3, Drishti-GS1, and iChallenge-PM, the F score (higher is better) increases by 0.42%, 0.2%, 0.43%, and 1.07%, and the overlap rate (higher is better) increases by 0.77%, 0.36%, 0.79%, and 1.89% respectively. We also conduct ablation experiments on RIM-ONE-R1 and Drishti-GS1. Results demonstrate the effectiveness of each part of our algorithm.ConclusionIn this study, we propose a new end-to-end convolutional network model based on UNet and apply it to the optic disk segmentation problem in practical medical image analysis. The extensive experiments prove that our method outperforms other state-of-the-art deep learning-based optic disk segmentation approaches and has excellent generalization performance. In our future work, we intend to introduce some recent loss functions, focusing on the segmentation of the optic disk boundary.关键词:Glaucoma;UNet;deep learning;optic disc segmentation;pre-trained;attention mechanism;DiceLoss107|69|10更新时间:2024-05-07
 -
 摘要:ObjectiveUltrasound images are widely used in clinical medicine. Compared with other medical imaging technologies, ultrasound(US) images are noninvasive, emit non-ionizing radiation, and are relatively cheap and simple to operate. To assess whether a heart is healthy, the ejection fraction is measured, and the regional wall motion is assessed on the basis of identifying the endocardial border of the left ventricle. Generally, cardiologists analyze and segment ultrasound images in a manual or semiautomatic manner to identify the endocardial border of the left ventricle on ultrasound images. However, these segmentation methods have some disadvantages. On the one hand, they are cumbersome and time-consuming tasks, and these ultrasound images can only be segmented by the professional clinicians. On the other hand, the images must be resegmented for different heart disease patients. These problems can be solved by automatic segmentation systems. Unfortunately, affected by ultrasound imaging device and complex heart structure, left ventricular segmentation suffers from the following challenges: first, false edges lead to incorrect segmentation results because the gray scale of the trabecular and mastoid muscles is similar to the myocardial gray scale. Second, the shapes of the left ventricular heart slice are irregular under the influence of the atrium. Third, the accurate positions of the left ventricles are difficult to obtain from ultrasound images because the gray value of the edges is almost the same with that of the myocardium and the tissues surrounding the left heart (such as fats and lungs). Fourth, ultrasound imaging devices produce substantial noise, which affects the quality of ultrasound images; thus, the resolution of ultrasound images is low and thus not conducive to ventricular structure segmentation. In recent years, algorithms for left ventricular segmentation have considerably improved; however, some problems remain. Compared with traditional segmentation methods, deep learning-based methods are more advanced, but some useful original information is lost when images are processed for downsampling. In addition, these methods hardly recognize the weak edges on ultrasound images, resulting in large errors in edge segmentation. Moreover, their segmentation accuracy is low because of substantial noise on ultrasound images. Considering the abovementioned challenges and problems, this study proposes the use of deep layer aggregation for residual dense networks(DLA-RDNet) to identify the left ventricle endocardial border on two-dimensional ultrasound images.MethodThe proposed method includes three parts: image preprocessing, neural network structure, and network optimization. First, the dataset must match the neural network after preprocessing the ultrasound images. This part includes two steps. In the first step, we locate the ventricle on ultrasound images in advance on the basis of prior information to avoid the interference of other tissues and organs. The second step is the expansion of the dataset to prevent overfitting of the network training. Second, a new segmentation network is proposed. On the one hand, we adopt a network connection method called deep layer aggregation(DLA) to make the shallow and deep feature information of images more closely integrated. Therefore, less detailed information is lost in the downsampling and upsampling processes. On the other hand, we redesign the downsampling network(RDNet). Combining the advantages of ResNet and DenseNet, we propose a residual dense network, which allows the downsampling process to retain additional useful information. Third, we optimize the neural network. For the redundant part of the network, we use the deep supervision(DS) method for pruning. Consequently, we simplify the network structure and improve the running speed of the neural network. Furthermore, the network loss function is defined by the combination of binary cross entropy and Dice. We use a sigmoid function to achieve pixel-level classification. Finally, the design of the segmentation network is completed.ResultExperimental results on the test dataset show that the average accuracy of the algorithm is 95.68%, the average cross ratio is 97.13%, Dice is 97.15%, the average vertical distance is 0.31 mm, and the contour yield is 99.32%. Compared with the six segmentation algorithms, the proposed algorithm achieves higher segmentation precision in terms of the recognition of the left ventricle in ultrasound images.ConclusionA deep layer aggregation for residual dense networks is proposed to segment the left ventricle in ultrasound images. Through subjective and objective evaluations, the effectiveness of the proposed algorithm is verified. The algorithm can accurately segment the left ventricle in ultrasound images in real time, and the segmentation results can meet the strict requirements of left ventricular segmentation in clinical medicine.关键词:ultrasound(US) image;left ventricular segmentation;deep layer aggregation(DLA);residual dense network(RDNet);network pruning39|84|4更新时间:2024-05-07
Medical Image Processing
-
 摘要:ObjectiveShip detection plays an important role in civil and military fields, including marine object identification, maritime transportation, rescue operation, marine security, and disaster relief. As a basic means of marine monitoring, ship detection in synthetic aperture radar (SAR) images has been studied for years. With the development of sensor and platform technologies, SAR big data are achieved, making it possible to perform automatic data-driven detection algorithms. Deep learning-based detection models have been proven to be a great success in common object detection tasks for natural scene images; moreover, it outperforms many traditional artificial feature based methods. However, when transferring them to SAR ship detection directly, many challenges emerge, and the results are not satisfying because natural and SAR images have several differences. Ship in SAR images usually appear as some bright parts and lack detail information in comparison with natural images because of the coherent imaging mechanism. The swath of SAR remote sensing images is large, but targets are distributed densely or sparsely; thus, the processing of SAR images is usually more complex than that of natural ones. In addition, the size and shape of ship targets vary, ranging from several pixels to hundreds. All these factors complicate ship detection in SAR images. Aiming to solve these challenges and considering the actual demands in practice, this study proposes a lightweight data-adaptive detector with a feature-optimizing mechanism on the basis of the famous single-shot detector (SSD) to improve detection precision and speed.MethodIn this study, the original SSD is modified by having the number of channels halved and the last two convolution blocks removed. The settings of the network parameters follow the outputs of proposed data-driven target distribution clustering algorithm, which leans the distributions of targets in the SAR dataset, including the size of ships and the aspect ratio of ships. The algorithm is free from human experience and can make the detector adapt to the SAR dataset. Trunked visual geometry group 16-layer net (VGG16) is utilized to extract features from input SAR images. Given that the features extracted by convolutional neural networks are hierarchical, low-level features with high spatial resolution usually contain extra local and spatial detail information, whereas more semantic and global information are involved in high-level features with low resolution. For object detection tasks, spatial and sematic information are important. Thus, information must be aggregated through a fusion strategy. A new bidirectional feature fusion mechanism, which contains a semantic aggregation and a novel attention guidance module, is proposed. In feature pyramid networks, the higher features are added to the lower features after an upsampling operation. On this basis, the up-sampled higher features in our model are concatenated with lower features in the channel dimension, and the channel numbers are adjusted through a 1×1 convolution operation. Instead of simply adding lower features to higher features, an inverse fusion from down to top and an attention mechanism are applied. A spatial attention map of each convolution block is generated, and the attention map that contains the most spatial information is selected as a weighted map. In the weighted map, target pixels with higher value are usually more noticeable, whereas the value of background pixels are suppressed. After down sample to weight map, element-wise multiplication is performed between the weighted map and the higher features. The features of the targets are strengthened; thus, spatial information is passed to higher level features. The optimized features are then entered into detector heads to predict the locations and types of targets; the low-level features mainly detect the small ships, whereas the high-level features are responsible for the large ones. The entire network is trained by a weighted sum of location and classification losses. In interference, nonmaximum suppression is used for removing repeated bounding boxes.ResultThe public SAR ship detection dataset widely used in SAR ship detection references is adopted in experiments. All the experiments are implemented using Python language under the TensorFlow framework on a 64-bit computer with Ubuntu 16.06, CPU Intel (R) Core (TM) i7-6770K @4.00 GHz×8, and NVIDIA GTX 1080Ti with CUDA9.0 and cuDNN7.0 for acceleration. The training iteration, initial learning rate, and batch size are set as 120 k, 0.000 1, and 24, respectively. A momentum optimizer is used, with weight decay, gamma, and momentum values of 0.000 5, 0.1, and 0.9, respectively. An ablation study is operated to verify the effectiveness of each proposed module, and the model is compared with five published state-of-art methods. Precision rate, recall rate, average precision (AP), and the average training and testing time on a single image, are taken as evaluation indicators. In the original SSD, a model with parameters from the proposed data-driven target distribution clustering algorithm improves the AP by 1.08% in comparison with the model with original parameters. The lightweight design of the network significantly improves the detection speed; compared with that of the SSD, the training and testing time of the proposed model decrease from 20.79 ms to 12.74 ms and from 14.02 ms to 9.17 ms, respectively. The semantic aggregation and attention fusing modules can improve detection precision, whereas when the two modules are used together, the optimum performance in detection precision is achieved. The AP increased from 77.93% to 80.13%, and the precision and recall rates increased from 89.54% to 96.68% and from 88.60% to 89.60%, respectively. However, speed is not considerably affected, and the model still runs faster than SSD. The proposed model outperforms other models in terms of precision and speed; moreover, it improves AP by 6.9%, 1.23%, 9.09%, and 2.9% in comparison with other four methods.ConclusionIn this study, we proposed a lightweight data adaptive single shot detector with feature optimizing mechanism. Experiment results show that our model have remarkable advantages over other published state-of-the-art detection approaches in terms of precision and speed.关键词:synthetic aperture radar (SAR) image;ship detection;cluster;feature fusion;attention mechanism27|38|9更新时间:2024-05-07
Remote Sensing Image Processing
- Postal code:100190
- Tel:010-58887035/58887030/58887418 Email:jig@aircas.ac.cn
- Technical support is provided by Beijing Founder electronics co., LTD 京ICP备05080539号-4
 京公网安备11010802024621
 - It is recommended to read the content of this site in Chrome&IE9+. Please switch to extreme mode in browser 360.
- Cookies We use cookies to help provide and enhance our service and tailor content. By continuing, you agree to the use of cookies.

0