
最新刊期
卷 25 , 期 3 , 2020
-
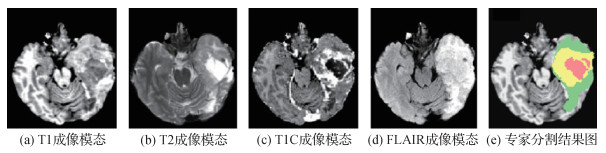 摘要:Brain tumor segmentation is an important part of medical image processing. It assists doctors in making accurate diagnoses and treatment plans. It clearly carries important practical value in clinical brain medicine. With the development of medical imaging, imaging technology plays an important role in the evaluation of the treatment of brain tumor patients and can provide doctors with a clear internal structure of the human body. Magnetic resonance imaging (MRI) is the main imaging tool for clinicians to study the structure of brain tissue. Brain tumor MRI modalities include T1-weighted, contrast-enhanced T1-weighted, T2-weighted, and liquid attenuation inversion recovery pulses. Different imaging modalities can provide complementary information to analyze brain tumors. These four types of modalities are usually combined to diagnose the location and size of brain tumors. At present, due to the extensive application of MRI equipment in brain examination, a large number of brain MRI images are generated in the clinical setting. This rise in the quantity of brain MRI images hinders doctors in manually annotating and segmenting all images promptly. Moreover, the manual segmentation of brain tumor tissues highly depends on doctors' professional experience. Therefore, research has focused on the ways to segment brain tumors efficiently, accurately, and automatically. In recent years, significant advancement has been made in the study of brain tumor segmentation methods. To enable other researchers to explore the theory and development of segmentation methods for brain tumor MRI images, this work reviews the current research status in this field. In this study, the current semiautomatic and fully automatic segmentation methods for brain tumor MRI images are divided into two categories:unsupervised segmentation and supervised segmentation. The difference between the two methods lies in the use of hand-labeled image data. Unsupervised segmentation is a nonpriori image segmentation method based on computer clustering statistical analysis. The unsupervised methods are divided into threshold-based, region-based, pixel-based, and model-based segmentation technologies according to the different segmentation principles. This work briefly describes the unsupervised methods according to the above classification and summarizes their advantages and disadvantages. The main feature of supervised segmentation is its use of labeled image data. The segmentation process involves model training and testing. In the former, labeled data are used to learn the mapping from image features to labels. In the latter, the model assigns labels to unlabeled data. Supervised segmentationis mainly based on the segmentation technology of pixel classification. It generally includes traditional machine learning methods and methods based on neural networks. The common traditional machine learning methods and the methods based on neural networks used in brain tumor segmentation are briefly described herein, and their advantages and disadvantages are summarized. The segmentation methods for brain tumor images based on deep learning are mainly described. With the advancement of artificial intelligence, deep learning, especially the new technology represented by convolutional neural networks (CNNs), has been well received because of its superior brain tumor segmentation results. Compared with traditional segmentation methods, CNNs can automatically learn representative complex features directly from the data. Hence, the research of brain tumor segmentation based on CNNs mainly focuses on network structure design rather than image processing before feature extraction. This study focuses on the structure of neural networks used in the field of brain tumor image segmentation and summarizes the optimization strategies of deep learning. Lastly, the challenge of brain tumor segmentation (BraTS) is introduced, and the future development trend of brain tumor segmentation is established in combination with the methods used in the challenge. The BraTS challenge is a competition to evaluate the segmentation methods for brain tumor MRI images.The BraTS challenge uses preoperative MRI image data from multiple institutional brains to focus on the segmentation of gliomas. In addition, the BraTS challenge involves predicting overall patient survival by combining radiological features with machine learning algorithms to determine the clinical relevance of this segmentation task. The segmentation methods for brain tumor MRI images have inherent advantages, disadvantages, and application scope. Researchers have been working on how to improve the accuracy of segmentation results, the robustness of models, and the overall operational efficiency. Hence, this study analyzes the advantages and disadvantages of various methods, the optimization strategies of deep learning, and future development trends. The optimization strategy of deep learning is as follows.In the aspect of imaging data, data enhancement techniques, such as flipping, scaling, and cropping, are used to increase the amount of training data and improve the generalization ability of models. Acascade framework is introduced to realize the segmentation of whole tumors, core tumors, and enhanced tumors by combining the acascade framework with the inclusion relationship of tumors in the brain anatomical structure. An improved loss function is used to deal with image category imbalances. In terms of network structure, multiscale and multichannel strategies are adopted to make full use of image feature information.In the process of downsampling, aconvolution operation is used instead of pooling so that image information can be further learned while reducing image information loss.Between the convolutional layers, the jump connection method is applied to effectively solve the degradation problem of the deep network.In different cases, the appropriate standardization method, activation function, and loss rate are selected to achieve satisfactory segmentation effects. This work summarizes the development trend of brain tumor segmentation methods by learning and arranging the methods used in the BraTS challenge. As a result of the diversification of MRI imaging modalities, making full use of the each modal image information can effectively improve the accuracy of brain tumor segmentation. Therefore, the reasonable utilization of multimodality images can be expected to become a research hotspot.Methods based on deep learning are outstanding in the field of brain tumor segmentation and have become a hot research direction.The defects of machine learning algorithms lead to an inaccurate segmentation of brain tumors. A popular trend is to improve the original method or combine various methods effectively. Remarkable progress has been made in the segmentation of brain tumor MRI images. The development of deep learning, in particular, provides new ideas for the research in this field. However, brain tumor image segmentation is still a challenging subject because brain tumors vary in size, shape, and position. Moreover, brain tumor image data are limited, and the categories are not balanced. As a result of the lack of interpretability and transparency in the segmentation process, the application of a fully automated segmentation method to clinical trials still requires further research.关键词:brain tumor image segmentation;magnetic resonance imaging (MRI);unsupervised segmentation;supervised segmentation;deep learning304|285|11更新时间:2024-05-07
Scholar View

-
 摘要:ObjectiveMany image processing models and algorithms in the field of image processing exist at present. Retinex algorithms and multifocus image fusion algorithms in the field have become the most widely used image processing algorithms because of their simplicity, efficiency, and easy implementation. However, Retinex algorithms and multifocus image fusion algorithms have limitations on image processing. This study aims to combine the algorithm with the ideas of Retinex and multifocus image fusion algorithms to achieve image enhancement. In view of the traditional Retinex algorithms, graying, halo, and boundary phenomena are considered, as well as the problem in which the details of high-exposure area is not enhanced. The traditional multifocus image fusion algorithms must capture multiple images of different focus points in the same scene, extract the focus area from multiple images of different focus points, and operate the focus area for multifocus fusion. Extracting the repeated operations of multiple image focus areas for the multifocus fusion algorithm is necessary. This study proposes a multifocus image fusion algorithm based on Retinex the improved bilateral filtering of Retinex.MethodThe Retinex algorithm is used to improve the process of estimating illumination images. The effects of image space proximity similarity and pixel similarity on the enhancement effect are fully considered. The improved kernel function of the traditional Retinex algorithm is enhanced to obtain an improved bilateral filter function. First, the improved bilateral filtering function is used to estimate the illumination image, and the influence of the illumination image on the visual effect is reduced or suppressed, and then the reflected image of the essence of the response image is obtained. Furthermore, the optimal parameters of the optimal bright and dark regions are calculated at the pixel level of the reflected image, and the optimal parameters are brought into the algorithm to find the optimal solution. The optimal solution can be used to decompose the reflected image into the optimal bright region and the optimal dark area. In combination with the idea of multifocus image fusion algorithms, the original image is introduced at the same time, which can ensure the enhancement effect of the image and preserve the detail and quality in the original image, so that the enhancement effect is more obvious and clear. The original image, optimal bright region image, and optimal dark region image are multifocus fusion, and the linear integral transform and adjacent pixel optimal recommendation algorithm are used to obtain a smooth and accurate steering map. The steering filter is used to further smooth the steering map. Using the processed guide map as a basis, the original image and optimal bright region are fused according to different focal lengths to obtain an image
T . The imageT is repeated with the optimal dark region image to obtain the process imageS by the aforementioned experimental steps and finally utilized. The pilot filter performs boundary repair on the process imageS to obtain a final result image.ResultPictures of a girl and a boat, which were selected for comparison experiments, with single-scale Retinex algorithm, bilateral filter-based Retinex algorithm, BIFT algorithm (Retinex image enhancement algorithm based on image fusion technology), and RVRG algorithm (Retinex variational model based on relative gradient regularization and its application). The proposed algorithm shows obvious advantages in variance and information entropy, specifically with the average of 16.37 higher than that of BIFT, and the average is increased by 20.90 compared with RVRG. The average increase is 1.25 higher compared with BIFT in terms of variance, which is an average increase of 4.42 compared with that of RVRG. In terms of information entropy, the average increase is 0.1 compared with that of BIFT, which is an average increase of 0.17 compared with that of RVRG. In terms of average gradient, the average increase was 1.21 compared with that of BIFT, which was an average increase of 0.42 compared with that of RVRG. Experimental data comparing BIFT and RVRG demonstrate the effectiveness of the proposed algorithm. The details in the original image and the dark portion of the right side of the car body in the image of the girl are significantly enhanced, and the details of the bright areas in the original image are well-preserved while being enhanced. The overall pixel value of the image is low and the visual effect is darker in the image of the boat. After the enhancement, the outline of the character is clear, the water surface is distinct, and the reef texture enhancement effect is remarkable.ConclusionThe extensive experiments show that due to the uncertainty of the process of acquiring images and the complexity of image information, the traditional algorithms are inevitably limited and the enhancement effect cannot meet the high-quality requirements of image preprocessing. Compared with the traditional algorithms, the combination of Retinex and multifocus fusion algorithms proposed in this paper has a better image enhancement effect. Compared with the single-scale Retinex, bilateral filter-based Retinex, BIFT, and RVRG, the reconstructed image is superior to the contrast algorithm at the subjective and objective levels. The objective evaluation parameters of the resulting image are greatly improved, especially in terms of information entropy. The algorithm in this paper can effectively suppress image graying, halo, and boundary prominent phenomena. The contrast is significantly enhanced and has a good enhancement effect on uneven illumination images and low contrast images, making it superior to other contrast algorithms in image enhancement and robustness. The image detail enhancement effect is particularly remarkable because it serves as the foundation for the subsequent image processing.关键词:Retinex algorithm;guided filtering;optimal bright and dark regions;generalized random walk;improved bilateral filtering56|471|3更新时间:2024-05-07 -
 摘要:ObjectiveThe texture is often characterized by various unregular types, varied shapes, and complex structures, which directly weaken the accuracy of texture image segmentation. The semantic segmentation methods based on deep learning need benchmark training sets. Constructing the training sets composed by the complex and diverse texture images is difficult. Therefore, utilizing the unsupervised image segmentation methods to solve the problem of texture segmentation is necessary. However, the traditional unsupervised texture image segmentation algorithms have limitations and cannot be used to effect tivelyextract the stable texture features.MethodBased on the idea that the Gabor operator can extract the texture diversity features and the local ternary pattern (LTP) operators imply the threshold differences, combining Gabor filters with extended LTP operators is proposed to describe texture diversity features in this paper. Gabor filter is used to extract the texture features of the same or similar texture patterns. Then, the texture difference features are extracted. Compared with the traditional LTP, the main advantages of the extended LTP operator are embodied in two aspects.On the one hand, the extended size make the LTP operator effective in image segmentation based on the size features of the segmented image.On the other hand, the weights are given to each position of the extended LTP operator. The exponential weight differences are given according to the distances between each position and the central point. Finally, these extracted features are integrated into the level set frame to segment the texture image. The advantages of the proposed method are described as follows:First, the extended LTP operator can effectively extract the texture difference features of local regions. Second, the Gabor filter and extended LTP operator are complementary. The main contributions of the proposed method in this paper are elaborated in the following:1) By improving the traditional LTP operator, we propose an extended LTP operator to extract the texture difference features of pixels in complex images. 2) The Gabor filter and extended LTP operator are complementary. The extended LTP operator and Gabor filter are combined and incorporated into the level set method. The extended LTP operator extracts the texture difference information of complex images, while the Gabor method detects similar information, such as similar frequency, size, and direction of images. The two operators have obvious complementary characteristics. Therefore, the extended LTP operator and Gabor filter are combined to extract the texture features of complex images in a complementary manner. The two operators are integrated into the level set method to effectively solve the segmentation problem of the complex images.ResultIn the experimental results section, the proposed method is compared with the classical unsupervised texture segmentation methods, including the methods based on Gabor filter, structure tensor, extended structure tensor, and local similarity factor. By segmenting all kinds of texture images, such as the images with varied texture directions and sizes, the images with the complex background, and the images with the weak texture features, the proposed method achieved better segmentation results than that of the traditional Gabor filter, where the structure tensor was expanded with the local similarity factor. By comparing the proposed method with the LTP-based method in this study, we found that the segmentation results of the proposed method are still better than those of the LTP-based method. In the experimental results section, the segmentation results of several commonly used level set methods (including Gabor filter, structure tensor, extended structure tensor, and robust local similarity factor (RLSF)) are presented and compared with the segmentation results of the proposed method. Fig. 8-10 show the advantages of the proposed method for segmentation of three types of texture images. More intuitively, specific quantitative results of segmentation accuracy were given for comparison between the proposed method and the various unsupervised texture segmentation methods in this study. On some typical texture images, the accuracy of the proposed method is more than 97%, which is higher than that of the other methods.ConclusionAn unsupervised multi-feature-based texture image segmentation algorithm is proposed in this paper. This method can be utilized to extract the features of the similar texture patterns and the texture differences by combining the Gabor filter and extended LTP operator. These texture features were integrated into the level set framework to segment the texture images accurately. Several experiments show that the proposed method can achieve desirable segmentation results for complex texture images in the real world. The advantages and disadvantages of the proposed unsupervised segmentation method were analyzed and the methods based on deep learning in the conclusion section. Compared with the segmentation methods based on deep learning, the proposed method is unsupervised, and therefore does not need prior or training information. However, the segmentation methods based on deep learning relies on training information heavily. Obtaining the training information of the complex texture images is difficult. At the same time, future research ideas are elaborated. Considering some structural relevance of texture images, our future work aims to focus on the extraction and analysis of texture structures to obtain improved segmentation effects.关键词:texture image segmentation;Gabor filter;extended local ternary pattern (LTP) operator;unsupervised43|131|1更新时间:2024-05-07
Image Processing and Coding
-
 摘要:Objective3D human pose estimation from monocular videos has become an open research problem in the computer vision and graphics community for a long time. An understanding of human posture and limb articulation is important for high-level computer vision tasks, such as human-computer interaction, augmented and virtual reality, and human action or activity recognition. The recent success of deep networks has led many state-of-the-art methods for 3D pose estimation to train deep networks end to end for direct image prediction. The top-performing approaches have shown the effectiveness of dividing the task of 3D pose estimation into two steps, as follows:using a state-of-the-art 2D pose estimator to estimate the 2D poses from images and then mapping them into 3D space. Results indicate that a large portion of the error of modern deep 3D pose estimation systems stems from 2D pose estimation error. Therefore, mapping a 2D pose containing error or noise into its optimum and most reasonable 3D pose is crucial. We propose a 3D pose estimation method by jointly using a sparse representation and a depth model. Through this method, we combine the spatial geometric priori of 3D poses with temporal information to improve the 3D pose estimation accuracy.MethodFirst, we use a 3D variable shape model that integrates sparse representation (SR) to represent rich 3D human posture changes. A convex relaxation method based on L1/2 regularization is used to transform the nonconvex optimization problem of a single-frame image in a shape-space model into a convex programming problem and provide reasonable initial values for a single frame of image. In this manner, the possibility of ambiguous reconstructions is considerably reduced. Second, the initial 3D poses obtained from the SR module, regarded as the 3D data with noise, are fed into a multi-channel long short term memory (MLSTM) denoising en-decoder in the form of pose sequences in temporal dimension. The 3D data with noise are converted into three components of X, Y, and Z to ensure the spatial structure of the 3D pose. For each component, multilayer LSTM cells are used to capture the different frames of time variation. The output of the LSTM unit is not the optimization result on the corresponding component; it is the time dependence between the two adjacent frames of the character posture of the input sequence implicitly encoded by the hidden layer of the LSTM unit. The time information learned is added with the initial value by using residual connection to maintain the time consistency of the 3D pose and effectively alleviate the problem of sequence jitter. Moreover, the shaded joints can be corrected by smoothing the constraint between the two frames. Lastly, we obtain the optimized 3D pose estimation results by decoding the last linear layer.ResultA comparative experiment is conducted to verify the validity of the proposed method. The method is conducted using the Human3.6M dataset, and the results are compared with the state-of-the-art methods. The quantitative evaluation metrics contain a common approach used to align the predicted 3D pose with the ground truth 3D pose using a similarity transformation. We use the average error per joint in millimeters between the estimated and the ground truth 3D pose. 2D joint ground truth and 2D pose estimations using a convolutional network are separately used as inputs. The quantitative experimental results suggest that the proposed method can remarkably improve the 3D estimation accuracy. When the input data are the 2D joint ground truth given by the Human 3.6 M dataset, the average reconstruction error is decreased by 12.6% after the optimization of our model as compared with individual frame estimation. Compared with the existing sparse model method based on video, the average reconstruction error is decreased by 6.4% after using our method. When the input data are 2D pose estimations using a convolutional network, the average reconstruction error is decreased by 13% after the optimization of our model as compared with single frame estimation. Compared with the existing depth model method, the average reconstruction error is decreased by 12.8% after using our method. Compared with the existing sparse model method based on video, the average reconstruction error is decreased by 9.1% after using our method.ConclusionCombining our MLSTM en-decoder based on temporal information with the sparse model, we adequately exploit the 3D pose prior knowledge, temporal, and spatial dependence of continuous human pose changes and achieve a remarkable improvement in monocular video 3D pose estimation accuracy.关键词:pose estimation;3D human pose;sparse representation;long short term memory (LSTM);residual connection69|59|1更新时间:2024-05-07
 -
 摘要:ObjectiveThe process of shooting a normal camera involves forming a 2D image after projecting a 3D scene onto the imaging plane. This process will lose the information of the scene, so the related research based on depth information cannot be developed. For example, target detection and tracking, 3D model reconstruction, and intelligent robots in industrial automation need to obtain depth information for the scene. The depth information of the scene is the basic problem in the field of machine vision. With the development of machine vision, the use of visualization methods to solve the deep extraction problem became an important topic in computer vision research. Among the methods, image depth measurement based on monocular vision has the advantages of simple equipment, low price, and fast calculation speed and could become a research hot spot today. The traditional measurement method based on monocular visual depth requires complex calibration of the camera, so the operability is not strong and it is difficult to apply in practice. Most of the traditional methods are only suitable for specific scene conditions, such as occlusion relations or defocusing in the scene, which limits the application of traditional methods. Aiming at the limitations of traditional methods, this paper proposes an object depth measurement method based on motion parallax cues, extracts feature points from images, analyzes the relationship between feature points and image depth, and obtains image depth results based on the relationship between the two.MethodThe method uses the parallax cues generated by the camera motion to obtain the image depth, so the method requires two images. The camera is mounted on a movable rail, and after the first image is taken, the camera is moved along the optical axis. The second image is taken at a distance when no adjustment to any parameter of the camera is required. First, the two images acquired by camera movement are segmented, and the region of interest (ROI) is segmented. Second, the improved scale-invariant feature transform algorithm proposed in this paper is used to perform two images. The results of image segmentation and image matching are combined to obtain the matching result of the object to be measured. Then, Graham scanning method is used to obtain the convex hull of the feature points after the two images are matched, thereby obtaining the length of the longest line segment on the convex hull. Finally, the basic principles of camera imaging and triangulation knowledge are used to calculate image depth.ResultThis proposed method is compared with another method, and results are provided in a table. The experiment is divided into two groups, mainly comparing the two methods from two aspects:measurement time and precision. The first set of experimental results show that the proposed method achieves good measurement results in a simple background environment. The error between the actual distance and the measured distance is 2.60%, and the time consumption of the measured distance is 1.577 s. The second set of experiments shows that when partial occlusion occurs in the scene, the error between the actual distance and the measured distance is 3.19%, and the time required to measure the distance is 1.689 s. By comparing the two sets of experimental data, we found that the method has improved the measurement accuracy and measurement time compared with the previous method, especially in reducing the image depth measurement time.ConclusionThrough research, the method estimates the image depth by moving the camera to obtain the corresponding line segment length on the two images, which avoids the complicated camera calibration process. This method improves the image matching algorithm and reduces the computational complexity, which is fast and accurate. The method of obtaining image depth information has certain research value and only needs to process the two pictures, where the hardware requirement is simple. The measurement process does not require a large amount of scene information, so the scope of application is wide. The method utilizes feature points on the image to perform image depth measurement, so the method is not constrained by partial occlusion of the measured object, and still has good robustness. However, as the method uses an image segmentation algorithm, the result of image segmentation greatly influences the accuracy of the measurement. If the captured image contains a complex background environment, obtaining accurate image segmentation results and ideal depth measurement results is difficult. Therefore, the directions of optimization and improvement of this method are adaptable to complex background environments.关键词:image depth;monocular vision;motion parallax;improved scale invariant feature transform (SIFT) algorithm;Graham scanning method20|44|1更新时间:2024-05-07
 -
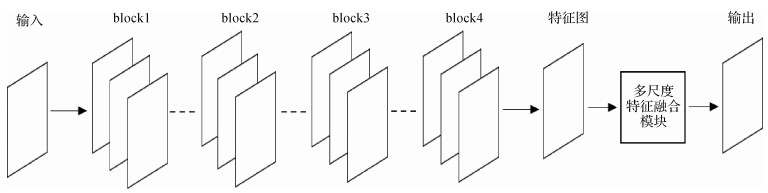 摘要:ObjectiveImage segmentation technology is one of the most difficult aspects of computer vision and image processing and is an indispensable step in the process of understanding and analyzing image information. The disadvantage of image segmentation technology is that the size and direction of the target in the image make the level of the image unpredictable. At the same time, the segmentation of images has a complex background, different brightness, and different textures is still problems in the image segmentation technology. The target semantic feature extraction effect directly influences the accuracy of image semantic segmentation. The image capturing device mounted on the robot has a variable spatial relationship with the target during the operation of the robot in the automated production line that segments the target by machine vision technology. When the image capturing device takes images from different distances and angles, the target has different scales in the image. The traditional single-scale feature extraction method has lower precision for semantic segmentation of the target. This study shows how to use the context information of the image to create the multiscale feature fusion module and develop the ability to extract rich target features and improve the segmentation performance of the network model.MethodThis paper proposes a method of workpiece target semantic segmentation based on multiscale feature fusion. The convolutional neural network is used to extract the multiscale local feature semantic information of the target, and the semantic information of different scales is pixel-fused so that the neural network fully captures context information of the image and obtains a better feature representation, thereby effectively achieving semantic segmentation of the workpiece target. The method uses the ResNet as the underlying network structure and combines the image gold tower theory to construct a multiscale feature fusion module. As the image pyramid is simply a change in image resolution, although the multiscale information representation of the image can be obtained, the output of the fourth block layer of the ResNet network is already a feature map with a small dimension. Reduced resolution of the feature map is not conducive to the feature response of the network model and tends to increase the amount of parameters calculated by the network model. Therefore, the resolution reduction operation in the original image pyramid is replaced in the form of the atrous convolution. The sensitivity field of the filter is effectively increased under a nonreduced resolution of the image, and the local feature information of the superior image can be fully obtained. In this study, a three-layer image pyramid is used, where the bottom layer image is the feature map of the Block4 layer output, the middle layer is a plurality of parallel atrous convolution layers with different sampling rates to extract local feature information of different scales, and the top layer is the fusion layer of the local feature information extracted by the middle layer.ResultThe method of this study is compared with the traditional single-scale feature extraction method through qualitative and quantitative experimental methods, and mean intersection over union (mIOU) is used as the evaluation index. Experiments show that the segmentation network model obtained by this method has more accurate segmentation ability for the targets in the test set. Compared with the traditional single-scale feature extraction network, the mIOU evaluation index of this method on the test set is improved by 4.84% compared with the network that also adopts the porous convolution strategy. The parallel structure proposed in this paper improves the mIOU evaluation index on the test set by 3.57%, compared with the network using the atrous spatial pyramid pooling strategy to improve the network semantic segmentation ability. The mIOU evaluation index of the method in the test set is also improved by 2.24%. When the test sample contains fewer types of targets and the target edges are clearer, more accurate segmentation results can be obtained. To verify that the method has certain generalization, this study uses the method to verify the dataset of the tennis court scene. The tennis court scene dataset includes nine categories of goals:tennis, rackets, inside the tennis court, venue lines, outside the tennis court, nets, people, tennis court fence, and sky. The size and scale of these types of targets are different, which is consistent with the multiscale feature extraction ideas proposed in this paper. Under the condition that the parameters set by the method are completely adopted and the network model has not optimized the parameter for the tennis court scene dataset in the mIOU evaluation index of the test set, the accuracy increased from 54.68% to 56.43%.ConclusionThis study introduces the labeling method of multi-workpiece datasets, and uses methods such as data expansion and definition of learning rate update to effectively prevent the overfitting phenomenon in network training and improve the basic performance of the network model. The value of the neural network depth and the value of the hyperparameter in the neural network training process are determined by comparing the experiments. At the same time, a multiscale feature fusion module is designed to extract multiscale semantic information of the target. The multiscale feature fusion enhances the ability of the neural network model to extract the target features, and the designed MsFFNet network model in more accurate in extracting the semantic features of the target. Therefore, the method can perform the semantic segmentation task of robot vision-based robotic grabbing target on the automated production line under the condition that the spatial position between the image capturing device and the target is variable. In this study, the network model determined by the specific dataset provides a reference value for the subsequent artifact detection. The next step will also focus on the generalization ability of the dataset of other industrial scenes.关键词:residual network;semantic segmentation;multiscale feature;deep learning;visual task31|47|4更新时间:2024-05-07
 -
 摘要:ObjectiveImage classification is one of the important research technologies in computer vision. The development of deep learning and convolutional neural networks (CNNs) has laid the technical foundation for image classification. In recent years, image classification methods based on deep CNN have become an important research topic. DenseNet is one of the widely applied deep CNNs in image classification, encouraging feature reusage and alleviating the vanishing gradient problem. However, this approach has obvious limitations. First, each layer simply combines the feature maps obtained from preceding layers by concatenating operation without considering the interdependencies between different channels. The network representation can be further improved by modeling feature channel correlation and realizing channel feature recalibration. Second, the correlation of the interlayer feature map is not explicitly modeled. Thus, adaptively learning the correlation coefficients by modeling the correlation of feature maps between the layers is important.MethodThe conventional DenseNet networks do not adequately consider the channel feature correlation and interlayer feature correlation. To address these limitations, multiple feature reweight DenseNet (MFR-DenseNet) combines channel feature reweight DenseNet (CFR-DenseNet) and inter-layer feature reweight DenseNet (ILFR-DenseNet) by ensemble learning method, thereby improving the representation power of the DenseNet by adaptively recalibrating the channel-wise feature responses and explicitly modeling the interdependencies between the features of different convolutional layers. However, MFR-DenseNet uses two independent parallel networks for image classification, which is not end-to-end training. The CFR-DenseNet and the ILFR-DenseNet models should be trained and saved in training. First, the models and weights are loaded, and the MFR-DenseNet needs multiple save and load. The training process is cumbersome. Second, the parameters and calculations are large, so the training takes a long time. In the test, the final prediction results of the MFR-DenseNet are obtained by taking an average of predictions from the two models. The parameters and test time are almost doubled compared with a single-channel feature reweight or interlayer feature reweight network. Therefore, the MFR-DenseNet has high requirements on the storage space and computing performance of the device in practical applications, thereby limiting its application. To address these limitations of MFR-DenseNet, this paper proposes an end-to-end dual feature reweight DenseNet (DFR-DenseNet) based on the soft attention mechanism. The network implements the channel feature reweight and interlayer feature reweight of DenseNet. First, the channel feature reweight and interlayer feature reweight method are integrated in DenseNet. By introducing a squeeze-and-excitation module (SEM) after each 3×3 convolutional layer, our method solves the problem of exploiting the channel dependencies. Each feature map of each layer in the SEM obtains a weight through a squeeze and excitation operation. The representation of the network can be improved by explicitly modeling the interdependencies between the channels. The output feature map of the convolutional layer is subjected to two squeeze excitation operations. Thus, the weight value of each layer can be obtained to achieve the reweight of the interlayer features. Then, DFR-DenseNet was constructed. The output feature map of each convolution layer completes the channel feature reweight and interlayer feature reweight through two channels. The concat and convolution operations were used to achieve the combination of two types of reweighted feature maps.ResultFirst, the DFR-DenseNet is compared with the serial fusion method and parallel-addition fusion method on the image classification dataset CIFAR-10, which proves that DFR-DenseNet is the most effective. Second, to demonstrate the advantage of the DFR-DenseNet, we performed different experiments on the image classification dataset CIFAR-10/100. To show the effectiveness of the method on the high-resolution dataset, we conducted the age classification experiment on the face dataset MORPH, and the age group classification comparison experiment was performed on the unconstrained Adience dataset. The image classification accuracy was significantly improved. The 40-layer DFR-DenseNet had a 4.69% error and outperformed the 40-layer DenseNet by 12% on CIFAR-10 with only 1.87% more parameters. The 64-layer DFR-DenseNet resulted in a 4.29% error on CIFAR-10 and outperformed the 64-layer DenseNet by 9.11%. On CIFAR-100, the 40-layer DFR-DenseNet and 64-layer DFR-DenseNet resulted in a 24.29% and 21.86% test error on the test set, and they outperformed the 40-layer DenseNet and 64-layer DenseNet by 5.56% and 5.41%, respectively. Age estimation from a single face image is an essential task in the field of human-computer interaction and computer vision, which has a wide range of practical applications. Age estimation consists of two categories:age classification and age regression. Adience is used for age group classification and obtained 58.79% accuracy. MORPH Album 2 is used for age regression. The 121-layer DFR-DenseNet had a 3.16 mean absolute error and outperformed the 121-layer DenseNet by 7.33% on the MORPH Album 2. Compared with the MFR-DenseNet, the DFR-DenseNet reduced the number of parameters by half. The test time of the DFR-DenseNet network was shortened to approximately 61% in the MFR-DenseNet test.ConclusionThe experimental results show that the end-to-end dual feature reweight DenseNet can enhance the learning ability of the network and improve the accuracy of image classification.关键词:dual feature reweight DenseNet(DFR-DenseNet);channel feature reweight;inter-layer feature reweight;image classification;end-to-end35|63|5更新时间:2024-05-07
 -
 摘要:ObjectiveStitching two different angles of silkworm surface images directly is not feasible even with several overlapping areas between them because the shape of a silkworm cocoon is long and elliptical and some information is compressed in its projection on the imaging surface. However, most of the existing image unfolding methods are aimed at cylinders with uniform radius, which is ineffective in the application of cocoon image unfolding. In this study, the surface image unfolding method of silkworm cocoon based on the equivalent step cylindrical model of a silkworm cocoon is proposed according to the shape characteristics of silkworm cocoon.MethodTo obtain the surface image of the silkworm cocoon, we designed a set of image acquisition devices, driving the cocoon rotation through the synchronous rotation of two rollers, thereby enabling the camera to conveniently collect the complete image of the silkworm cocoon surface. We assume that the mathematical model of the silkworm cocoons is a rotational ellipsoid, and the image is subjected to gray scale, filter, binarization, and edge extraction successively. Thereafter, the extracted edges are fitted to obtain the ideal mathematical model of the cocoon in the image. A cylinder can be unfolded along one side to a rectangle, where the ideal silkworm cocoon model is divided into n segments along the rotational axis according to the calculus. The height of each segment is Δh.Given that Δh is small, the curve can be regarded as a straight line, so a small segment of the ellipse can be equal to a cylinder, and the cocoon model becomes a super position of a series of cylindrical models. Therefore, an equivalent stepped cylinder model of the cocoon model is obtained. The diameter of each small segment of the cylinder is calculated by the diameters of the upper and lower surfaces of the ellipsoidal segment replaced by the cylinder. As the diameter of the silkworm cocoon is extremely small (18 mm), the error brought by the camera aperture imaging model can be ignored, and the camera catches the parallel projection image of the silkworm cocoon. We set a coordinate system of OW to XWYWZW as the world coordinate system, o to xy as the original imaging plane, and o to uv as the unfolding plane. Based on the world coordinate system, the pixel coordinate mapping relationship between the unfolding plane of the stepped cylinder model and original image is derived. Reverse mapping is performed by a linear interpolation algorithm, and each pixel in the unfolded image is traversed. The surface unfolding image of the silkworm cocoon is obtained based on the equivalent step cylindrical model with the corresponding pixel values extracted from the original image using the given mapping relationship.ResultThe experiment was conducted by the 3D-printed step cylindrical model and the cocoon. In example 1, the surface of the step cylindrical model of 3D printing was pasted with a small black-and-white checker board with a size of 1 mm×1 mm. After the images were acquired, the stepped cylinder image was unfolded using the unfolding method and the cylinder unfolding method with the maximum radius value of the cocoon as the unfolding value. Given that the squares of the checkerboard used in the experiment had the same size, in the ideal state, the size of each square in the unfolded image should be the same. Therefore, based on the coordinates and size of the white grid in the center of the image, the theoretical value of the corner points of all the squares in the ideal unfolded image can be calculated. The unfolding effect is compared by the difference between the coordinate values of the upper left corners of the two unfolding methods and the theoretical values. Results show that the coordinate values obtained by the equivalent step-cylinder surface unfolding method are more than a match for the theoretical value compared with the equal-diameter unfolding method with maximum radius value, and the average relative error is much smaller. In example 2, the equivalent step-cylinder surface unfolding method is tested by a common silkworm cocoon image. When the cocoon image is obtained and preprocessed according to the elliptical circumscribing rectangle, the image is obtained by the ellipse fitting to extract the region of interest, so that the long axis of the ellipse remains vertical and the excess background is removed. The roller control motor of the image acquisition device starts. When the silkworm cocoons rotate a certain angle, the camera obtains another angle of cocoon image with overlapping area with the previous image, and the same preprocessing step on the image is performed to obtain the ROI area of the silkworm cocoon. The two images are unfolded by the unfolding method proposed in this paper. By manually splicing the two unfolded images and observing the silkworm cocoon texture of the overlap of the stitched image and the edge of the overlap region, we can find that the texture continuity of the silkworm cocoon is better and the unfolded image has an improved stitching effect.ConclusionResults show that the step cylinder unfolding method proposed in this paper has a better unfolding effect than the unfolding method with a single radius value, which can provide a good environmental basis for the mosaic subsequent research on silkworm cocoon surface images. In addition, the method can be applied to the unfolding of other ellipsoidal surface images.关键词:silkworm cocoon sorting;image processing;cylindrical image unfold;step cylindrical model;mathematical modeling40|62|6更新时间:2024-05-07
Image Analysis and Recognition
-
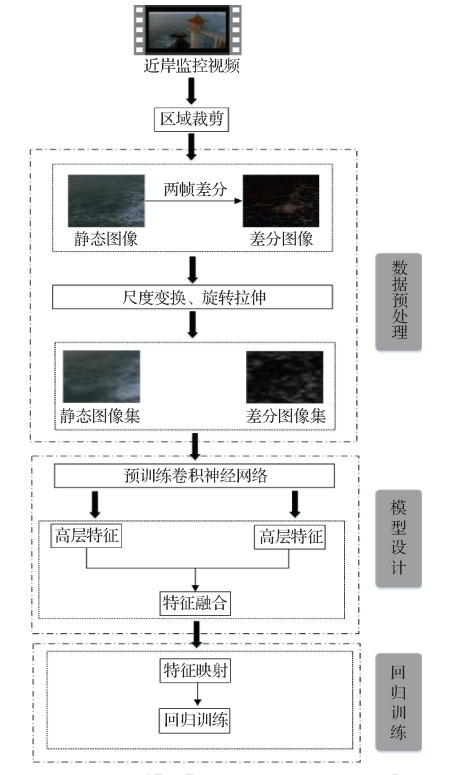 摘要:ObjectiveNearshore waves are significantly affected by seabed topography, shore, and environmental flows, following complex evolutionary laws with faster temporal and spatial transformations than open sea waves. Therefore, measuring nearshore wave height is significant for nearshore engineering design, shallow sea production operations, and nearshore environmental protection. The traditional wave height measure mainly relies on wave buoy monitoring. Compared with the traditional manner, nearshore video surveillance has advantages in uninterrupted data acquisition and abundant visual expression of waves. However, automatic wave height detection of nearshore waves through videos is insufficient at present. Existing methods of wave height detection based on visual information can be divided into two categories:1) Wave parameter detection based on stereo vision. Most models are complex, lacking robustness, and characterized by unstable detection of wave height; thus, they cannot satisfy the practical application. 2) Wave parameter detection based on image/video extracted features, including statistical features, transform domain features, and texture features. This type of method is mainly used to detect the direction of wave and wave height, which necessitates design features in advance, and is thereby limited by prior knowledge. In recent years, deep learning has achieved considerable success in image identification, nature language processing, and object recognition. Combined with the feature learning mechanism of deep learning, an automatic wave height detection method for nearshore wave video is proposed in this paper.MethodThe proposed method mainly involves data preprocessing, model design and feature fusion, and regression prediction. First, the video frames are extracted from the nearshore surveillance video at intervals, and the two adjacent frames are subtracted to form a set of differential frames. The dataset of original video frames contains static spatial information of waves and the dataset of differential images contains motion information of waves. To avoid the influence of reefs and buildings on wave feature extraction, we intercepted the wave area in the video by eliminating near-zero parts in the differential image. To enhance the generalization ability and robustness of the model, we used the data augment method to rotate and stretch the image to increase the number and diversity of datasets. Second, a network in networks (NIN)-based system for wave height detection was constructed. The high-level spatial and temporal features are learned by two independent NINs using static and differential images of the waves as input. The 4-layer structure of NIN is used for the spatial feature learning, while the 2-layer structure is used for the temporal feature learning. The two types of features are fused by simple concatenation because pixel-wise fusion may bring mutual interference and information loss. Finally, the fused features are fed into a support vector regression (SVR) model that maps features into 1D space and performs regression to achieve automatic detection of wave height of nearshore video images.ResultOur wave videos were collected from a marine station in China Sea from November 2015 to November 2016. The shooting time ranged from 7 a.m. to 4 p.m. To explore the performance of the different network models and the effect of the sample size of dataset on the wave height detection results, we conducted two sets of experiments. Experiment 1:We compared our NIN-based wave height detection model with a classic 2-layer convolutional neural network and a more advanced dense convolutional network (DenseNet). Based on the root-mean-square-error (RMSE) between predicted wave heights and the ground truth as the assessment index, the comparison results show that NIN-based network model can achieve more accurate wave height prediction with RMSE of 0.188 4. Experiment 2:To select the appropriate network input size, the wave height detection models with different sample sizes were trained and their performance was compared on test datasets under different tolerant ranges of absolute error from 0.2-0.4. The result shows that the input sample size of 32×32 pixels has the highest accuracy under the condition of absolute error < 0.2 and has a relatively stable change as the change of absolute error ranges. In consideration of the integrity of image feature information expression and noise interference, the experimental data used in this study was set to the uniform size of 32×32 pixels. Experiment 3:The roles of temporal and spatial feature fusions were examined. The high-level spatial features were learned from static video frames and the temporal features from the difference image between two adjacent frames. Compared with only using spatial features, fusing spatial features with temporal features achieved a significant increase in wave detection accuracy under various tolerance ranges of absolute error, and the detected wave height is less fluctuating. The average absolute error of the method in the detection of wave height is 0.109 5 m, and the average relative error is 7.39%. According to the wave height levels, the wave height detected by our proposed method can satisfy the absolute error range of±0.1 m below the wave level 2. The average relative error of the wave height above level 2 is less than 20%, which satisfies the demand for operational use of wave forecasting.ConclusionThe method can be used to automatically obtain wave height value from nearshore wave videos, which effectively compensates for the incompleteness of artificial design features. Moreover, our method has better practicality within the scope of operational detection requirements; thus, it has an average relative error of wave height ≤ 20%. Our method can meet the requirements for accuracy and efficiency in significant wave height detection, and provides a new platform to use nearshore videos for wave monitoring.关键词:wave height detection;nearshore wave video;deep learning;network in network architecture;feature extraction45|74|2更新时间:2024-05-07
Image Understanding and Computer Vision
-
 摘要:ObjectiveThe cotton plant number is a key indicator to evaluate the effect of cotton mechanized sowing at the seedling stage of cotton plant growth. The growth level classification is important in decision-making for water and fertilizer management in the later growth stages. Conventional approaches to the estimation of seedling plant number and growth level classification were often based on ground visual check and subjective evaluation by farming technicians, which can be time-consuming, laborious, error-prone, and difficult to meet the needs of precision field management, which is especially true in arid areas, such as in Xinjiang, China, due to the sparsely populated and desert-oasis environment. Although previous studies had investigated cotton growth monitoring, these studies mostly focused on a large area due to the limitations of image spatial resolution, and few studies had worked on the cotton plant number estimation of the seedling stage. Therefore, the objective of the present study is to develop an automated and accurate approach to estimating the cotton plant number and characterizing the growth status of the seeding stage cottons based on high-resolution imagery.MethodMultispectral remote sensing images over the cotton field of the study area in Shihezi City, Xinjiang were collected by a Micro MCA12 snap multispectral camera (Tetracam, United States) mounted on a low-altitude unmanned aerial vehicle (UAV) platform. The camera can capture 12 channels images at the visible to near-infrared wavelengths. The UAV system flew approximately 30 m above the ground, and a grey board with 48% reflectance was used to conduct exposure correction of the camera before taking off. Three grey boards with reflectance of 3%, 22% and 48% were setup inside the field of the study area during the UAV flights. After acquiring the images, we used the standard reflectance curves of the grey boards to calibrate the images and retrieved the reflectance images after the preprocessing. The images were mosaicked with the commercially available software Pixe4D Mapper to generate the reflectance images of the study area. A total of 35 ground samples of 1 m×1 m were collected and photographed synchronously with a digital camera vertically from the ground. Normalized difference vegetation index (NDVI) and visible brightness (VB) derived from the UAV images were segmented using the Otsu algorithm to extract vegetation pixels and eliminate the interference caused by the bright spots of plastic mulch film in the field left from previous farming work. Before the Hough transform was performed to obtain the central lines of crop rows, multiple successive morphological dilation and skeleton extraction of the binary image of vegetation were conducted to reduce computational complexity and avoid detection of false central lines. Buffer analysis was developed with the central lines of cotton rows to remove weeds, thereby improving the efficiency and accuracy of subsequent analysis. Consequently, cotton pixels were delineated and vectorized into cotton plant objects from which 18 morphological features were finally extracted from the binary image. A total of 1 046 cotton objects were extracted with the aid of in-situ measured data, and were divided into two subsets using the stratified sampling strategy:524 for training and 522 for testing. Random forest algorithm was adopted to extract optimal features from the 18 features using the training samples before the statistical model for the estimation of plant number was created, and a subset of feature variables was selected based on the importance analysis of out-of-bag (OOB) data of the random forest algorithm. The selected variables were utilized to build a support vector regression (SVR) model for estimating the number of cotton plants. Three ratio indices, namely, seedling proportion, seedling density, and healthy seedling proportion, were calculated based on the estimation of cotton plant number. Finally, the overall growth level was evaluated based on farming knowledge about the cotton plantation in the Shihezi area.ResultThe results showed that the SVR and support vector classification (SVC) models achieved high accuracy and good generalization ability under the same training and testing datasets. The SVR model performed better at the testing dataset (the determinant coefficient R2=0.940 1, root mean square error (RMSE)=0.592), and training dataset (R2=0.945 6, RMSE=0.510 7), while the SVC model achieved significantly inferior accuracies at the testing dataset (R2=0.922 7, RMSE=0.718 3) and at the training dataset (R2=0.918 9, RMSE=0.755 6). This difference in performance may be due to the combination of the skewness of the dataset and the difference between the classification and regression algorithms. Accuracy assessment indicates that the spatial distribution of the overall growth levels is consistent with the field check in the study area. The current limitation and possible improvement of the proposed method were discussed.ConclusionWith the analysis of the correlation between cotton plant number and morphological features of the cotton objects in the UAV images with very high spatial resolution, the application of a low-altitude UAV platform integrated with a high-resolution multispectral sensor effectively identified the number of plants and classified the overall growth levels of cottons in the seedling stage. However, the proposed approach in this study aimed at monitoring seedling-stage cotton growth in the arid area with typical oasis agriculture may not be applicable for the other growth stages of cotton. This research provides a reference for field management and the application of UAV in precision farming. Future studies intend to focus on the estimation of the height of cotton plants using a low-altitude UAV system, which is extremely useful for evaluating the growth of the plant in the seedling stage and other growth stages.关键词:unmanned aerial vehicles (UAV);multispectral remote sensing;support vector regression(SVR);cotton seedling plant number;growth levels;Shihezi City19|6|4更新时间:2024-05-07
 -
 摘要:ObjectiveObject extraction is a fundamental task in remote sensing. The accurate extraction of ground objects, such as buildings and roads, is beneficial to change detection, updating geographic databases, land use analysis, and disaster relief. Relevant methods for object extraction, such as for roads or buildings, have been observed over the past years. Some of these methods are based on the geometric features of objects, such as lines and line intersections. The most traditional approaches can obtain satisfactory results in rural areas and suburbs with high identification and positional accuracy, but low accuracy in complex urban areas. With the rise of deep learning and computer vision technology, a growing number of researchers have attempted to solve the related problems through deep learning method, which is proven to greatly improve the precision of object extraction. However, due to memory capacity limitations, most of these deep learning methods are patch-based. This operation cannot fully utilize the contextual information. At the edge region of the patch, the prediction confidence is much lower than that of the central region due to the lack of relevant information. Therefore, additional epochs are needed for feature extraction and training. In addition, objects often appear at extremely different scales in remote sensing images; thus, determining the right size of the vision area or the sliding window is difficult. Using larger patches to predict small labels is also an effective solution. In this manner, the confidence of the predicted label map is greatly increased and the network is easier to train and converge.MethodThis study proposes a novel architecture of the network called double-vision full convolution network (DVFCN). This architecture mainly includes three parts:encoder part of local vision (ELV), encoder part of global vision (EGV), and fusion decoding part (FD). The ELV is used to extract the detailed features of buildings and EGV is used to give the confidence over a larger vision. The FD is applied to restore the feature maps to the original patch size. Visual geometry group(VGG)16 and AlexNet are applied as the backbone of the encoder network in ELV and EGV, respectively. To combine the information of the two pathways, the feature maps are concatenated and fed into the FD. After the last level of FD, a smooth layer and a sigmoid activation layer are used to improve the feature processing ability and project the multichannel feature maps into the desired segmentation. Finally, skip connections are also applied to the DVFCN structure so that low-level finer details can be compensated to high-level semantic features. Training the model started on an NVIDIA 1080ti GPU with 11 GB onboard memory. The minimization of this loss is solved by an Adam optimizer with mini-batches of size 16, start learning rate of 0.001, and L2 weight decay of 0.000 5. The learning rate drops by 0.5 per 10 epochs.ResultTo verify the effectiveness of DVFCN, we conducted the experiments on two public datasets:European building datasets and Massachusetts road datasets. In addition, two variants of the DVFCN were tested, and U-Net and Mnih were also operated for comparison. To comprehensively evaluate the classification performance of the model, we plotted the receiver operating characteristic (ROC) curves and precision-recall curves. The area under the ROC curve (AUC) and F1 score were regarded as evaluation metrics. The experimental results show that DVFCN and U-Net can achieve almost the same superior classification performance. However, the total training time of DVFCN was only 15.4% of that of U-Net. The AUC of U-Net on building datasets and road datasets were 0.965 3 and 0.983 7, which were only 0.002 1 and 0.005 5 higher than DVFCN, respectively. The extraction effect on road and built-up was better than that of Mnih. In addition, the confidence rates of the two networks were also calculated. The experimental results show that the confidence of interval DVFCN is better than that of U-Net under 95% confidence. The importance of ELV and EGV is also studied. Result shows that the ELV is more important than EGV because it can provide more detailed local information. EGV performs poorly by itself because it can only provide global information. However, the global information is important for the convergence of DVFCN.ConclusionThe DVFCN is proposed for object extraction from remote sensing imagery. The proposed network can achieve nearly the same extraction performance as U-Net, but the training time is much reduced and the confidence is higher. In addition, DVFCN provides a new full convolution network architecture that combines the local and global information from different visions. The proposed model can be further improved, and a more effective method of combining local and global context information will be developed in the future. Thus, studying the utilization of global information through a global approach is important.关键词:remote sensing;object extraction;fully convolutional networks;double vision;local information;global information13|5|1更新时间:2024-05-07
Remote Sensing Image Processing
-
 摘要:ObjectiveIn remote sensing image processing, pan-sharpening is used to obtain a multispectral image spatially and spectrally with a high resolution by merging an original multispectral image with low spatial resolution and a panchromatic image with a high spatial resolution of the corresponding scene. Pan-sharpening has been widely used as a pre-processing tool in various vision applications, including change detection, object recognition, military intelligence, medical assistance, and disaster monitoring. Traditional pan-sharpening methods are mainly divided into two:component substitution (CS) and multire solution analysis (MRA). The fusion result of the CS method has high spatial resolution but easily generates spectral distortion. The MRA method can efficiently maintain spectral information but generates spatial degradation. To improve the spatial resolution of the fusion result while reducing spectral distortion, we use a variational approach based on several assumptions. In general, the difference among bands in multispectral images is rarely considered in the variational method, resulting in the same spatial information injected into each band to cause spectral distortion. Thus, different spatial information must be injected for each band to reduce spectral distortion. Most previous studies have used upsampled images as prior knowledge, but distortion will occur when the image is upsampled. To use the original multispectral image further accurately, we use prior knowledge. The degradation process is added to the method to maintain the spectral relationship among bands further because of the degradation of the upsampled image.MethodA new pan-sharpening algorithm based on variational method is built. Given the differences between the MS bands, injecting the same spatial information for each band is unsuitable. To avoid spectral distortion and over sharpening caused by injecting excessive spatial information into multispectral images, we use spatial information constraints based on adaptive weights to inject different spatial information into each band. For the degradation problem of upsampled multispectral images, we use the information of the original and upsampled multispectral images in the model in different ways. First, the original multispectral image is used as a priori knowledge to maintain the spectral information by using channel gradient and local spectral consistency constraints. Second, the introduction of inaccurate inter-band relationship is avoided to reduce the accuracy of the fusion result. By considering the degradation process into the model, the spectral relationship correction constraint is used to restrain the fused result after the degradation for maintaining the relative relationship among the bands of the original multispectral image. The gradient descent algorithm is used to solve the objective function, and a numerical solution framework is designed to obtain the fused result. All experiments are implemented in MATLAB 2017 and executed on a computer with an Intel (R) 3.6 GHz central processing unit and 32 GB memory.ResultWe compare the proposed model with six state-of-the-art pan-sharpening algorithms, including wavelet, Gaussian low-pass full-scale regression-based approaches, joint intensity-hue-saturation and variational method, variational model for P + XS image fusion, guided filter, and nonlinear intensity-hue-saturation method. The quantitative evaluation metrics contain correlation coefficient (CC), erreur relative globale adimensionnelle de synthèse (ERGAS), root mean squared error (RMSE), peak signal-to-noise ratio (PSNR), spectral angle mapper (SAM), relative average spectral error (RASE), and spectral information divergence (SID). To show the validity of the model, we perform four sets of experiments for comparison. Experimental results show that our model outperforms all other methods in the Geoeye and Pleiades datasets, except in SAM and CC. Comparative experiments demonstrate that the fusion algorithm improves spatial resolution while reducing spectral distortion. In comparison with the suboptimal of all comparison algorithms in Pleiades dataset, average CC and PSNR (the higher the value, the better) increased by 0.74% and 1.85%, respectively; average ERGAS, RASE, RMSE, and SID (the lesser the value, the better) decreased by 8.27%, 6.71%, 6.57%, and 8.07%, respectively. In comparison with the suboptimal of all comparison algorithms in Geoeye dataset, the PSNR increased by an average of 1.16%, and average ERGAS, RASE, RMSE, SAM, and SID decreased by 8.84%, 3.90%, 4.17%, 5.83%, and 15.81%, respectively.ConclusionIn this paper, we propose a new pan-sharpening model based on adaptive weight mechanism. Geoeye and Pleiades data are used as test data, and the model is compared with six excellent algorithms. Experiment results show that our model outperforms the six state-of-the-art pan-sharpening approaches and improves high spatial resolution while mitigating spectral distortion.关键词:remote sensing image fusion;multi-spectral image;variational method;adaptive weights;channel gradient constraints;spectral correlation correction constraint24|20|3更新时间:2024-05-07
 -
Raster geographic data dual watermarking based on visual cryptography and discrete wavelet transform
 摘要:ObjectiveRaster geographical data are important and sensitive. Once the raster geographic data are destroyed or tampered with, security risks to users occur. In addition, if users maliciously disseminate data, many unauthorized users will use the data beyond their authority, which also poses a threat to the data security. Strengthening the integrity of data inspection is necessary to prevent data from being destroyed and tampered with. Strengthening the copyright protection of data is also necessary to prevent raster geographic data from being maliciously disseminated. With the various requirements of integrity checking and copyright protection for watermarking, achieving the requirements of integrity checking and copyright protection at the same time by embedding only one watermarking information in raster geographic data is difficult. If the two technologies are combined, then the protection of raster geographic data will be comprehensive, and the dual watermarking technology can simultaneously achieve integrity checking and copyright protection.MethodXOR(2, 2)-VCS and discrete wavelet transform (DWT) are used to embed double watermarking into digital raster geographic data. Semi-fragile watermarking is used as the first watermarking for integrity test. The watermarking information is embedded according to the size relationship between the horizontal component
$HL$ $LL$ $\boldsymbol{W}_1$ $\boldsymbol{W}'_1$ $HL$ $LL$ $_2^2$ $\boldsymbol{W}_{2}$ $\boldsymbol{W}_2^1$ $HL$ $LL$ 关键词:raster geographic data;visual cryptography;discrete wavelet transform;digital watermarking;integrity check;copyright protection69|4|1更新时间:2024-05-07 -
 摘要:ObjectiveA mixed pixel represents a number of ground features.The spectral curve of the mixed pixel is affected by a combination of these features, and nature corresponds to multiple categories of labels. The label information of a mixed pixel is represented by a single label in the single-label classification, which causes loss of information.In the classification of hyperspectral features, mixed pixels have negative effects on single-label classification in two aspects. When a single type of ground feature is mixed with a different type of ground feature, its spectral characteristics change, and it loses its uniqueness and causes a larger difference within the class.When the mixing ratio of multiple ground features increases, the spectral curves tend to be closer to each other so that the difference between classes becomes smaller.To resolve the conflict between single label frame and mixed pixel, we apply the technique of multilabel classification to the classification of hyperspectral features.Applying the technique of multi-label classification to hyperspectral feature classification, we assign a corresponding label to a pure pixel, and a mixed pixel is assigned a corresponding set of labels. The application of multi-label technology distinguishes between pure and mixed pixels so that the spectral curves of pure pixels of different features do not have large intraclass differences and can maintain their uniqueness. Pixels with a deeper mixing ratio can have multiple labels in a multi-label framework without being forced to retain only one label.Under the labeling of multiple labels, mixed pixels can retain most of the label information and can also avoid the precision degradation caused by single label classification.MethodIn the multi-label classification of hyperspectral features, the characteristics of hyperspectral data and unequal status of mixed pixel labels should be considered. Label-specific features in hyperspectral multi-label classification are observed, where a band feature combination with strong discrimination ability for a certain label exist. The similarity between hyperspectral curves can be measured by Euclidean distance and spectral angle. Based on hyperspectral characteristics, this paper organically combines Euclidean distance and spectral angle to build label-specific features of multi-label learning with label specific features LIFT algorithm.Thus, a new LIFT method suitable for hyperspectral multi-labels was born.Based on the inequality of label status, this study marks the label with the maximum abundance for the multi-label model, and sets a greater weight for the label with the maximum abundance than other labels in the KNN method to form the prediction of the maximum abundance label.ResultThe following results are obtained by comparing multi-label classification with single-label classification. On the Samson and Jasper Ridge datasets, multi-label classification performs better in all indicators than single-label classification. On the Urban dataset, multi-label classification performs better than single-label classification in indicator precision and indicator
$F^β$ 关键词:remote sensing;hyperspectral classification;multi-label classification;multi-label learning with label specific features(LIFT);label-specific feature;spectral similarity21|5|2更新时间:2024-05-07 -
 摘要:ObjectiveFine resolution images with high acquisition frequency play a key role in earth surface observation. However, due to technical and budget limitations, current satellite sensors have a tradeoff between spatial and temporal resolutions. No single sensor can simultaneously achieve a fine spatial resolution and a frequent revisit cycle although a large number of remote sensing instruments with different spatial and temporal characteristics have been launched. For example, Landsat sensors have fine spatial resolutions (15~60 m) but long revisit frequencies (16 days). By contrast, a moderate resolution imaging spectro-radiometer (MODIS) instrument has a frequent revisit cycle (1 day) but a coarse spatial resolution (250~1 000 m). In addition, optical satellite images are frequently contaminated by clouds, cloud shadows, and other atmospheric conditions. These factors limit applications that require data with both high spatial resolution and high temporal resolution. Spatio-temporal satellite image fusion is an effective way to solve this problem. Many spatio-temporal fusion methods have been proposed recently. Existing spatio-temporal data fusion methods are mainly divided into the following three categories:weight function-based methods, unmixing-based methods, and dictionary learning-based methods. All of these methods require at least one pair of observed coarse- and fine-resolution images for training and a coarse-resolution image at prediction date as input data. The output of spatio-temporal fusion methods is a synthetic fine-resolution image at prediction date. All spatio-temporal fusion methods use spatial information from the input fine-resolution images and temporal information from the coarse-resolution images. Unfortunately, existing spatio-temporal fusion methods cannot achieve satisfactory results in accurately predicting land-cover type change with only one pair of fine-coarse prior images. Thus, spatio-temporal satellite image-fusion method based on linear model is proposed to improve the prediction capacity and accuracy, especially for complex changed landscapes.MethodThe temporal model is assumed to be independent of sensors, and a linear relationship is used to represent the temporal model between images acquired on different dates. Therefore, the spatio-temporal fusion is transformed into estimating parameters of the temporal model. To accurately capture earth surface change during the period between the input and prediction dates, we carefully analyzed the reasons for the temporal change, and then the temporal change was divided into two types:phonological and land cover type. The former is mainly caused by differences in atmospheric condition, solar angle at different dates, and is global and flat. The latter is mainly caused by the change on the surface, and is local and abrupt. Therefore, parameters of the model from global and local perspectives were estimated. To accurately estimate the parameters, we need to search for similar pixels in the local window to ensure that the pixels used for parameter estimation satisfies spectral consistency. Moreover, considering that the land-cover type may change during the period, we find that the spatial distribution of similar pixels may change at different dates. Therefore, a multi-temporal search strategy is introduced to flexibly select appropriate neighboring pixels. Only pixels that have similar spectral information to the target pixel at both base date and prediction date are considered to be similar pixels, which eliminate the block effect of traditional algorithms. After searching similar pixels and solving the temporal model, the input fine resolution image was combined with the temporal model to predict fine image at target date. The aforementioned strategies make our method achieve good prediction results even if the earth surface changed drastically.ResultWe compared our model with two popular spatio-temporal fusion models:spatial and temporal adaptive reflectance fusion model (STARFM) and flexible spatiotemporal data fusion (FSDAF) method on two datasets. The experiment results show that our model outperforms all other methods in both datasets. In the first experiment, the dataset constitutes primarily phenological change. Therefore, all three methods achieve satisfactory results and our method achieves the best result. Quantitative comparisons show that our method achieves high correlation coefficient (CC), peak signal-to-noise ratio (PSNR), structural similarity (SSIM), and lower root mean square error (RMSE). Compared with STARFM and FSDAF, our method increases CC by 0.25% and 0.28%, PSNR by 0.153 1 dB and 1.379 dB, SSIM by 0.79% and 2.3%, and decreases RMSE by 0.05% and 0.69%. In the second experiment, the dataset has undergone dramatic land-cover type change. Therefore, both STARFM and FSDAF have block effects at different levels visually. In quantitative assessment, compared with STARFM and FSDAF, our method increases CC by 6.64% and 3.26%, PSNR by 2.086 dB and 2.510 7 dB, SSIM by 11.76% and 11.2%, and decreases RMSE by 1.45% and 2.08%.ConclusionIn this study, a spatio-temporal satellite image-fusion method based on linear model is proposed. This method uses a linear model to represent the temporal change. By analyzing the characteristics of the temporal change, the temporal model is constrained from local and global perspectives, and the solved model can represent the temporal change accurately. In addition, the method uses a multi-temporal similar pixel search strategy to search for similar pixels more flexibly, thereby eliminating the block effect of previous methods, fully utilizing spectral information in neighboring similar pixels, and improving the accuracy of prediction results. The experimental results show that in terms of visual comparison, compared with two popular spatiotemporal fusion methods, the proposed method can predict land-cover type change more accurately, and our findings are close to the true image. In the quantitative evaluation, our method improves CC, PSNR, RMSE, SSIM, and other indicators to varying degrees in each band.关键词:remote sensing;spatio-temporal fusion;linear model;weight function-based method;parameter estimation15|0|3更新时间:2024-05-07
 -
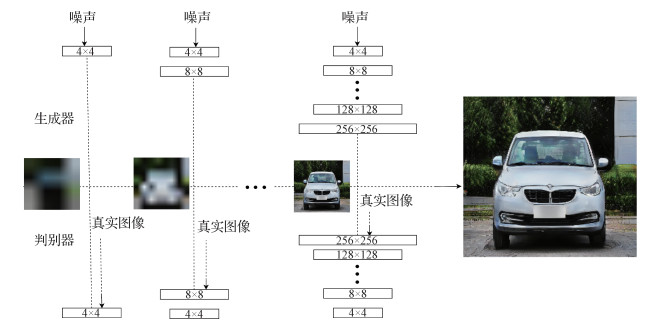 摘要:ObjectiveComprehensive perception of traffic management through computer vision technology is particularly important in intelligent transportation systems. Vehicle recognition is an important part of intelligent transportation systems, and fine-grained car model recognition in vehicle recognition is currently the most challenging subject. However, the traditional method has high demand for prior information on the data, while the deep learning method requires large-scale data, and the fitting effect is poor when the amount of data is small. Labelling a large number of vehicle images manually is a time-consuming task. Several deviations in manual labelling are observed due to the strong similarity between different categories of vehicle recognition. To obtain more abundant data from vehicle image features, we propose the attention-progressive growing of generative adversarial network(AT-PGGAN) model.MethodThe AT-PGGAN model consists of a generation network and a classification network. The generation network is used to augment the training data. For fine-grained vehicle recognition, most of the current work is based on high-resolution images. Given that the existing generation network is not ideal for generating high-resolution images, the generated high-resolution images cannot be directly used for fine-grained recognition. In this study, the attention mechanism and label re-embedding method are used to optimize the generation network to ensure that the high-resolution image details are perfect and are therefore conducive to discriminating the true features of the network extracted from the image. This paper proposes a method of label recalibration, which involves recalibrating the label data of the generated images and filtering the generated images accordingly, and then removing the generated images that do not meet the requirements. This approach solves the problem of poor image quality from another aspect. The relabeled generated and original images are collectively used as input data of the classification network. As no direct connection exists between the generation and classification networks, the classification part can use multiple classification networks, thereby improving the universality of the model.ResultBased on the proposed model in this paper, the existing vehicle model images can be well augmented and used for fine-grained vehicle model recognition. In the public dataset StanfordCars, a 1% improvement over the classification network that does not use the AT-PGGAN model for data augmentation was observed. Compared with other networks on CompCars, the top1 and top5 accuracy rates of this method are higher than those of the existing methods under the same condition. Comparing several different semi-supervised image label calibration methods, we find that the method proposed in this paper shows the best results for different sample sizes. Different numbers of generated images also have a certain influence on the recognition accuracy. When the number of generated images reaches that of the original samples, the recognition accuracy is the highest. However, when the generated images continue to increase, the recognition accuracy decreases. In the comparative experiment, the progressive growth strategy has a basic improvement on the generation algorithm, and because a large number of images that do not meet the standard are screened out in the process of label recalibration, the influence on the feature extraction is removed, and the experimental results prove that the labels strongly affect the results. Relabeling is the major improvement to the algorithm.ConclusionThe generative adversarial network is used for data augmentation and enhancement, and the generated images can effectively simulate the original image data. The images generated in the classification task have a regular effect on the original image data.The generated image data can improve the fine-grained recognition accuracy of the image. Thus, generating clear high-resolution images is the key to the problem. Different label calibration methods have great influence on the results. Therefore, effective calibration of image label generation is another way to solve the problem effectively.关键词:fine-grained recognition;vehicle model recognition;generative adversarial network;attention mechanism;semi-supervised learning26|4|1更新时间:2024-05-07
 -
 摘要:ObjectiveVehicle logo recognition is an important part of anintelligent transportation system (ITS). The vehicle sign carries information about the vehicle, which is important for vehicle information collection, vehicle identification, and illegal vehicle tracking. The vehicle logo, which is designed in various shapes, is a distinctive feature of the vehicle with good independence and representativeness. Through the classification and identification of the vehicle logo, the range of the vehicle model can be greatly reduced, and the pre-classification of the vehicle model can be realized. In practical applications, the traditional handcrafted feature-based methods have fewer training samples, the recognition speed is fast, and the requirements on the equipment are low.Therefore, the traditional handcrafted feature-based methods appear more suitable for actual needs.Although the existing vehicle logo recognition (VLR) method has achieved good recognition results, the final recognition rate is limited and difficult to improve. VLR is a vital part of an intelligent transportation system. Even a small increase in recognition rate can bring great social value. To discover the potential problems and difficulties in VLR, we analyzed samples that have been incorrectly identified.Results show that most of the blurred vehicle logo images are not correctly classified. To extract more representative vehicle image features and effectively reduce the interference caused by blurred images, this paper proposes a vehicle identification method based on anti-blur feature extraction.MethodOur method first constructed a car image pyramid based on the Gaussian pyramid, which can effectively simulate the human eye. The image anti-texture and anti-edge blur features of the image were extracted to express the information on the logo. The localized LPQ mode is used for anti-texture blurred feature extraction, which can enhance the robustness of the original features. In this process, the feature codebook is generated by clustering the sample features to quantize the feature, and the feature vector of all images is generated based on the codebook. In the process of extracting anti-edge blur features, the HOG feature extraction based on local block weak gradient elimination method is used for anti-edge blurred feature extraction, which can effectively describe the edge feature of vehicle logos and, at the same time, improve their anti-blur ability. Finally, the CCA method is used to fuse the two anti-blur features for subsequent dimensionality reduction and classification.CCA is a multivariate statistical analysis method that uses the correlation between pairs of integrated variables to reflect the overall correlation between the two sets of indicators.ResultExperiments are conducted based on the blurred vehicle logo dataset (BVL) constructed in this study and two other open vehicle logo datasets. The method achieved a 99.04% recognition rate on the public vehicle dataset HFUT-VLunder 20 training samples. With the increase in the number of samples, the method has a higher upper limit of recognition rate. In addition, the method achieves a recognition rate of 97.19% on the fuzzy car logo dataset BVL constructed under 20 training samples. On the more difficult XMU, the proposed method achieves a recognition rate of 96.87% under 100 training samples. The results show that our method can achieve good recognition results and perform strong robustness and anti-fuzziness.ConclusionIn this study, the scale invariance of the method is added to the construction of the car image pyramid. At the same time, the improved local quantization mode LPQ feature extraction method improves the anti-texture ability of the feature. By eliminating the local block weak gradient information of the HOG feature, we have improved the anti-edge blurring ability of the feature.Finally, the recognition ability of the vehicle logo images with insufficient imaging quality is improved through the fusion of features, thereby improving the final recognition rate, which is proven suitable for the recognition of vehicle logos in practical applications.关键词:vehicle logo recognition;gradient feature;anti-blur feature;local quantization;image pyramid12|4|1更新时间:2024-05-07
 -
 摘要:ObjectiveIncreasing application of face recognition systems improves the security of identity authentication systems and the effectiveness of face detection has become an urgent problem. In recent years, the development of face recognition has the advantages that users do not require to cooperate with the recognition equipment, and can recognize face images in a timely manner, with moderate cost, stable security, and intuitive results, thereby making face recognition a widely used technology. Thus, among all biometric features that can achieve spoofing attacks, face spoofing attacks is the first to bear the brunt. An illegal visitor can easily obtain photos of legitimate users in multiple ways, which poses a serious threat to the security system of legitimate users. Therefore, the detection of face anti-spoofing, reduction of threats to face anti-spoofing, and assurance of security of the recognition system are urgent problems to be solved. This paper proposes a novel face detection algorithm to perform photo anti-spoofing.MethodAccording to the single difference clue between images to solve the face anti-spoofing, the algorithm has a problem of low universality. The face anti-spoofing method proposed in this paper combines three differential cues, namely, facial micro-texture change, optical strain feature map, and depth feature network. The entire experimental process combines the micro-texture information analysis method of the image, life information analysis method, and deep learning method, and divides the entire experimental flowchart into local binary patterns (LBP) image local texture feature operator to extract an LBP feature map. The total variation regularization and the robust L1 norm TV-L1 optical flow method extracts image optical flow information, and the optical strain feature describes small changes in the adjacent image frame motion and deep network extraction features, which are eventually classified into four parts. The specific steps of algorithm implementation are described in the following. First, the selected NUAA dataset and Replay-attack dataset are processed into a group of data every 10 frames. After face feature points are located in Dlib, Face++ API is used to extract facial landmarks for face alignment and crop as grayscale images to mask the effect of light on the image recognition. The LBP feature extraction operation is conducted on the cropped grayscale image to obtain the LBP feature map, which can effectively describe the image spatial information. Second, optical flow information is extracted from the LBP feature map to improve the robustness of noise adaptation, and then the derivative of the optical flow is calculated to obtain the optical strain map of the image, thereby characterizing the small amount of movement of the micro-texture properties between successive frames. Finally, convolutional neural network model (CNN) is used to encode each strain map into feature vector to extract the spatial information of the strain image, and then through the feature vector to the long short term memory (LSTM) model to learn the sequential information of the continuous image and perform classified prediction to discriminate between photo attacks used by legitimate or illegal users.ResultThe experiments are performed on two public human face anti-spoofing databases and compared with the representative algorithm. This paper mainly focuses on the face anti-spoofing detection algorithm for photo spoofing attacks. Therefore, the sample part of the database related to photo attacks is selected as a negative sample of experimental data, and the real face is used as a positive sample. According to the analysis of the experimental results, the NUAA database results show that the accuracy of the proposed algorithm is 99.79% in this study. Compared with the second detection method based on CNN, the algorithm has an accuracy rate that is improved by approximately 1.5%. The experimental results of the Replay-attack database show that the accuracy of our method is 98.2%. The experimental comparison results of our algorithm outperform the state of the art in identifying photo attacks.ConclusionThe optical strain maps are used to effectively represent the dynamic spatiotemporal information between frames and these maps are used as the input data to represent the spatial features at time
$t$ 关键词:face anti-spoofing;local binary patterns(LBP);total variation regularization and the robust L1 norm(TV-L1) optical flow method;optical strain;long short term memory(LSTM)14|4|3更新时间:2024-05-07
Column of CACIS 2019
- Postal code:100190
- Tel:010-58887035/58887030/58887418 Email:jig@aircas.ac.cn
- Technical support is provided by Beijing Founder electronics co., LTD 京ICP备05080539号-4
 京公网安备11010802024621
 - It is recommended to read the content of this site in Chrome&IE9+. Please switch to extreme mode in browser 360.
- Cookies We use cookies to help provide and enhance our service and tailor content. By continuing, you agree to the use of cookies.

0