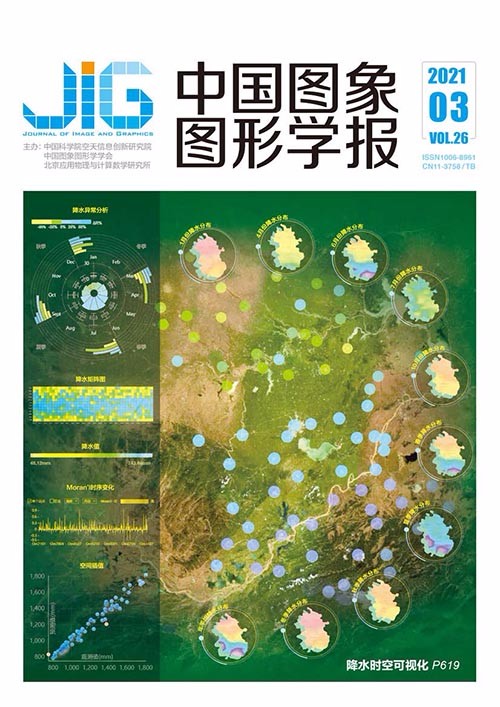
降水时空关联特征可视分析
摘 要
目的 降水是影响全球气候变化和系统环境的重要因素,面向降水数据开展时空关联分析,对于区域气候特征探索及异常情况监测具有重要的意义。然而,降水时空关联特征的分析是一个复杂且耗时的过程,与气象站点的空间分布以及降水的时间序列密切相关。本文综合考虑降水的时空变化特征,研究和设计面向降水数据时空关联特征分析的可视化系统工具。方法 利用地图和矩阵图呈现降水数据的空间分布和周期变化特征,设计径向盒须图对降水数据的时空变化异常特征进行捕获;通过局部Moran's I指数的计算和热力图的呈现表达降水的空间相关性,支持用户交互式地探索空间相关性的时序变化特征;利用普通克里金插值模型获得降水空间插值图,并对插值结果的准确性进行可视化评估。结果 以中国安徽省1971-2014年气象观测站长时间序列月降水数据集为例进行分析,实验结果证明本研究可视化交互系统能够直观高效地探索区域降水长时间序列时空变化特征和极端降水情况;有效探究区域降水空间分布模式、不同站点降水信息间空间依赖性和异质性,并快速发现降水奇异点;分析区域不同时间尺度降水气候特征空间变化。结论 系统工具集成便捷的交互模式,支持用户探索式地分析降水数据的时空关联特征,进而有效地探究区域气候变化规律和特征分布关系。基于真实降水数据的实验结果以及降水领域专家的反馈,进一步验证了本文系统工具的有效性和实用性。
关键词
Visual analytics of spatial and temporal correlation features of rainfall
Zhou Zhiguang1,2, Xie Wanying1, Zheng Weihua1, Chen Yuanyuan1(1.School of Information Management and Artificial Intelligence, Zhejiang University of Finance and Economics, Hangzhou 310018, China;2.State Key Laboratory of CAD&CG, Zhejiang University, Hangzhou 310058, China) Abstract
Objective Rainfall is one of the important factors that affects global climate change and system environment. Conducting the spatiotemporal correlation analysis of rainfall data for exploring regional climate characteristics and monitoring climate abnormal conditions has great significance. However, the spatial and temporal correlation analysis of rainfall data is a complicated, time-consuming process due to the drastic spatiotemporal variation and spatial heterogeneity of rainfall, and the diversity of rainfall data. It is closely related to the geographical locations of meteorological stations and the time series of rainfall. Therefore, a visual analysis method for the spatiotemporal correlation analysis of rainfall data in the paper is proposed by considering the spatial locations of meteorological stations and the rainfall variations over a long period of time. Based on spatiotemporal visualization analysis of rainfall data, the spatiotemporal correlation characteristics and climate characteristics of rainfall are further quantified. Method A map view is first used to reflect the basic information of rainfall and meteorological stations, enabling users to select meteorological stations interactively. The spatial correlation of rainfall data is explored by using the local Moran index, allowing the interactive selection of one or more sites and the temporal analysis of the mean value of the local Moran index. The temporal changes and outliers of rainfall data are presented by using periodic matrix graph and the circular box-and-whisker graph, respectively. The spatial interpolation map is obtained by an ordinary Kriging interpolation method, and the accuracy of the interpolation result is further evaluated. Finally, a set of continent user interactions is integrated into the visualization system to help users easily conduct spatiotemporal exploration of rainfall data and deeply obtain insights into the features of interest hidden in the complex rainfall data structures. Result Taking the monthly rainfall data set of Anhui meteorological observation stations from 1971 to 2014 as an example, the experimental results show the following. 1) The visual interactive system of our study can intuitively and efficiently explore the spatiotemporal variation characteristics and anomalies of regional rainfall time series. The spatial distribution differences of regional precipitation can be clearly shown in the map view. The periodic matrix view can directly reflect the basic periodic rule that the rainfall is mainly concentrated in the spring and summer seasons and the minimum in winter, and reflect the interannual differences of rainfall in different months of the station and several evident rainfall anomalies. Furthermore, the long-term series variability of precipitation in different months and the drought and flood conditions in different seasons from 1971 to 2010 in Anhui Province can be rapidly analyzed and observed by the box-and-whisker graph and ring graph. 2) The spatial distribution pattern, spatial dependence, and heterogeneity of rainfall information of different stations can be effectively explored by using the thermal diagram and time series diagram of Moran's I values. Results show that the monthly rainfall in Anhui Province has a strong local aggregation pattern and zonal regularity, and a different spatial structure at different times, which reflects the complex, changeable influence of climate and terrain on rainfall. 3) The spatial variation of regional rainfall climate characteristics at different time scales can be clearly analyzed by using the precipitation spatial interpolation map using ordinary Kriging method. Unexpectedly, the average precipitation in July of Anhui Province from 1971 to 2010 is mostly concentrated in the north, west, and southwest. Conclusion A visual analysis system is developed to help users explore and analyze the spatiotemporal correlation, extreme conditions, and regional climate features of rainfall data interactively. It is more intuitive, efficient, and easier to operate than the traditional analysis software. The system can effectively discover several unexpected phenomena and conclusions of experts, and further verify the existing conclusions. Furthermore, the system has good extensibility, which can be applied to the visual analysis of not only spatiotemporal correlation characteristics of precipitation data but also other geographical spatiotemporal observation data, such as temperature data, sunshine hour data, and air quality data. Our visual analysis system can help experts in related fields explore and analyze rainfall spatiotemporal data. A large amount of experimental results and expert feedback further verify the effectiveness and practicality of the proposed method. Only precipitation data are analyzed, a large amount of other types of meteorological monitoring data remain, and substantial spatial and temporal characteristics between the data are noted. The function of visual analysis in this paper must be further expanded to achieve the visual analysis of multiple meteorological monitoring data. In addition, a certain correlation is observed between different meteorological monitoring data. Although this system can effectively explore the spatiotemporal correlation characteristics of rainfall data, the correlation characteristics and modeling between rainfall data and other meteorological monitoring data have not been involved. In the future work, we will focus on the development of visual analysis methods for relationship modeling of multiple meteorological monitoring data.
Keywords
rainfall spatio-temporal correlation features periodic variation characteristic Moran's I ordinary Kriging interpolation
|


 中国图象图形学报 │ 京ICP备05080539号-4 │ 本系统由