|
|
|
发布时间: 2022-10-16 |
遥感图像处理 |
|
|
|


|
收稿日期: 2021-05-25; 修回日期: 2021-08-12; 预印本日期: 2021-08-19
基金项目: 国家自然科学基金项目(42071351);辽宁省教育厅基础研究项目(LJ2019JL010);辽宁工程技术大学学科创新团队资助项目(LNTU20TD-23)
作者简介:
郭伟,女,副教授,主要研究方向为图像与视觉信息计算、智能数据处理。E-mail:guow9966@163.com
申磊,通信作者,男,硕士研究生,主要研究方向为遥感图像处理、目标检测。E-mail:1377791752@qq.com 曲海成,男,副教授,主要研究方向为遥感影像高性能计算、目标检测与识别。E-mail:quhaicheng@lntu.edu.cn 王雅萱,女,硕士研究生,主要研究方向为深度学习、高光谱图像处理。E-mail:940556702@qq.com 林畅,女,硕士研究生,主要研究方向为图像与视觉信息计算、智能数据处理。E-mail:1228536807@qq.com *通信作者: 申磊 shenlei95821@163.com
中图法分类号: TP751.1
文献标识码: A
文章编号: 1006-8961(2022)10-3127-12
|
摘要
目的 合成孔径雷达(synthetic aperture radar, SAR)图像舰船目标检测在军事、民生领域发挥重要作用。由于SAR图像背景复杂且多为小尺度舰船目标,同时图像中的相干斑噪声导致舰船目标边缘模糊,现阶段目标检测模型无法快速高效地实现目标检测任务。为了提高模型检测精度,使模型具有更好的鲁棒性,提出了自适应权重金字塔和分支强相关的SAR图像检测模型。方法 对特征提取网络提取的特征图经过采样、融合处理获得特征自适应权重,然后利用权重指导每层特征图充分融合空间位置信息和语义信息,更好地检测小尺度目标;分支强相关模块融合分类分支和回归分支的特征,对融合后的待检测特征分别采用1×1、3×3对称卷积核和1×3、3×1非对称卷积核捕获不同的舰船特征;构建IoU(intersection over union)分支,利用IoU分支作用于分类分支,避免高IoU低分类置信度的候选框被抑制,通过设置平衡因子平衡IoU分支和分类分支,使其能更好地指导回归分支优化候选框。结果 在公开的遥感数据集SSDD(SAR ship detection dataset)上实验结果表明,本文模型的检测精度达到90.53%,F1值提升至94.35%,检测速度达到20.14帧/s。与其他SAR图像舰船目标检测算法相比有较好的检测效果。结论 实验结果表明该模型相比原始模型具有更好的检测效果,满足实时性检测需求,在SAR图像实时检测中具有实际意义。
关键词
目标检测; 合成孔径雷达(SAR); 自适应权重; 分支相关; 平衡因子
Abstract
Objective Synthetic aperture radar(SAR) imaging is interfered with the echo due to electromagnetic waves penetrate the rough object surface by emitting electromagnetic pulses and receiving reflected echo imaging, resulting in coherent spot noise. However, its multi-temporal and all-weather features are used in maritime applications like rescue, monitoring and vessel transportation supervision. Constant false alarm rate algorithm is use for SAR image target detection in common. It has the simple algorithm structure, but the complex and uneven distribution of ocean clutter types can cause missing detection. In the case of multiple targets, it is easy to appear that the reference unit contains target information, so the amplitude of target signal may be greater than the clutter amplitude, resulting in the estimated threshold is far greater than the real threshold. The constant false alarm rate algorithm cannot obtain the ideal detection effect. In recent years, with the rapid development of deep learning, object detection algorithms based on deep learning have achieved good results in optical image object detection. SAR images are different from optical images in that the targets in SAR images are mostly small-scale ships with bright spots and lack obvious details. Similar targets such as islands, buildings and so on will form similar ship shapes after electromagnetic wave reflection. Therefore, the application of optical detection models directly to SAR images cannot achieve ideal results. Feature pyramid network adopts top-down layer by layer fusion, so the high-level feature map lacks spatial location information, and the fusion of each level largely loses the semantic information contained in high-level features, while the semantic information of low-level features is insufficient. In order to improve the model detection accuracy and make the model more robust, a SAR image detection model with adaptive weight pyramid and branch strong correlation is proposed in this paper. Method The high-level features extracted by ResNet101 contain rich semantic information, and the underlying features contain rich spatial information. To have a better detection effect of target detection model, the feature map is required to contain semantic information and spatial location information both. Therefore, the featured information needs to be adopted based on a more effective fusion mechanism for fusion. It is necessary to use effective weights to guide the fusion mechanism for to the integration of more effective information. Our adaptive weight pyramid module is demonstrated, which first samples the feature map to make it have the same scale, then stitches concatenation the feature map after each layer of sampling into channel dimensions, adjusts the number of channels by 1×1 convolution, and generates the weight in the end through the Softmax function. To get a feature map of the layer, multiply each layer feature by the corresponding weight, and the other layers are analogy. Its fusion removes some redundant information under the weighting of machine learning. Multiple features are extracted through 1×1 and 3×3 symmetric convolution kernels and 1×3 and 3×1 asymmetric convolution kernels, following the feature fusion of classification branch and regression branch by the branch correlation module. The feature diagram contains the classification branch information in the regression branch based on the fused classification and regression features. In the detection phase, the candidate boxes are removed related to accurate positioning and low classification confidence, which reduces the detection accuracy of the model greatly. In order to solve this problem, the intersection over union(IoU) detection head is constructed in the regression branch, and IoU it is used for classification branch, thus avoiding the problem of the candidate box with high IoU low classification confidence being suppressed. In order to balance the IoU branch and the classification branch, the constrained balance factor is designed sand can guide the regression branch optimization candidate box better. Result Our model is evaluated on the public remote sensing dataset SSDD(SAR ship detection), which had 1 160 pictures, including 2 456 vessel targets. The dataset is divided dataset into training sets and test sets by a ratio of 7 : 3, and enhanced the learning ability of the model by rotating, flipping, brightness and increasing Gaussian noise. All the experimental environments are based on ubuntu16.04 LTS operating system, equipped with CPU for lntel (R) Core (TM) i7-7700@3.6 GHz ×8, graphics card for NVIDIA GTX1080Ti memory for 11 GB, running under the Tensorflow framework, through CUDA8.0 and cuDNN5.0 accelerated training. Our model learning rate is set to 0.000 5, the learning rate is attenuated by 1/10 per 40 k iterations, and the network is convergent at 80 k iterations completely. The non-maximum suppression threshold is 0.5 and the predicted probability threshold is 0.6. The recall rate, accuracy rate, average accuracy, F1 value and detection speed are represented as the evaluation indexes of the model. The model realizes the best detection effect in terms of equilibrium factor takes 0.4. The final recall rate is increased from 89.17% to 93.63%, the accuracy rate is increased from 87.94% to 95.08%, the average accuracy is increased from 86.91% to 90.53%, F1 value is increased from 88.55% to 94.53%, and the detection speed reached 20.14 frame/s. Conclusion Our experimental results demonstrate that the feature map targets fused by adaptive weight pyramids are more prominent, and the strong correlated branches module enhances the correlation between the classification branch and the regression branch, and improves the candidate box regression ability. Our model has it potential to meet the real-time detection requirement of SAR imaging.
Key words
object detection; synthetic aperture radar(SAR); adaptive weight; related branches; balance factor
0 引言
与可见光和红外波段传感器获取图像的方式不同,合成孔径雷达(synthetie aperture radar, SAR)只记录了一个波段的回波信息,生成的SAR图像主要反映地物的后向散射信息,图像信噪比较低。但是合成孔径雷达成像不受天气条件限制,具备全天时、全天候的特点。在军事侦察、海上救援和渔业监控领域广泛应用。因此,利用SAR图像对海洋舰船目标检测成为图形图像处理的研究热点。
传统的SAR图像目标检测算法主要包括检测和判别两个步骤。基于背景杂波统计分布的恒虚警率检测算法(constant false alarm rate,CFAR)是通过对海洋杂波进行统计建模确定阈值(Abu和Diamant,2020),把输入信号与该阈值对比确定有无目标;基于极化分解的舰船目标检测(Sugimoto等,2013)是将协方差矩阵做去旋转角度处理来进一步提高舰船目标的二次散射,降低体散射,最后送入检测器;基于极化特征的舰船目标检测(Wang等,2012)通过对相干矩阵做滤波处理来解决SAR图像中舰船方向位模糊问题。传统目标检测模型依赖手动提取特征,需要检测目标和背景有较高的对比度,模型泛化能力和鲁棒性差,在复杂场景下模型检测效果并不理想。
随着深度学习技术快速发展,深度特征提取和强大的自适应学习能力,推动了深度学习在SAR图像目标检测领域的应用。基于深度学习的目标检测分为双阶段目标检测和单阶段目标检测。双阶段方法Fast R-CNN(Girshick,2015)经过一系列的卷积层和池化层提取特征,通过RoI(region of interest)得到一个固定的特征图,输入到全连接层完成分类和回归;Faster R-CNN (Ren等,2017)在主干网络中用RPN(region proposal network)代替selective search方法生成建议窗口。单阶段方法中SSD(single shot multi-box detector)模型(Liu等,2016)在特征图上生成多种不同尺度的候选框,并直接进行分类和回归,少了候选框筛选的过程;同为单阶段方法,YOLO (you only look once)(Chang等,2019)则是将图像分成
深度学习算法与传统目标检测算法相比,具有更好的鲁棒性和泛化能力。但是SAR图像舰船尺度变化较大,且多为小目标,直接将卷积神经网络(convolutional neural network,CNN)模型及其衍生模型应用到SAR图像检测,容易出现漏检和误检。在近海岸受复杂背景信息影响,检测框不能调整到理想效果。
针对以上问题,本文提出了一种自适应权重金字塔和分支强相关的目标检测模型。该模型由自适应权重金字塔和分支强相关模块组成,自适应权重金字塔生成包含语义信息和空间位置信息的特征图,分支强相关模块加强了分类和回归的关联。本文的主要工作有:
1) 设计超参数自动学习每一层的权重,利用每一层特征和对应权重融合特征高层语义信息和底层位置信息,得到含有语义信息和位置信息的特征层;
2) 设计融合模块,融合分类分支和回归分支,增强两分支的相关性;
3) 在回归分支增加IoU(intersection over union)分支,通过IoU分支中包含的位置信息来指导回归分支更好地调整候选框。
1 单阶段目标检测模型
SAR图像具有的全天时、全天候的特点决定了其在海上监测、海上救援方面的广泛应用,这就要求对SAR图像检测的较高实时性。以SSD、YOLO为代表的单阶段检测模型去除了region proposal(Wang等,2019a)阶段生成大量可能包含目标的边界框,利用分类器判别该框中是否包含目标的工作,在实时性方面更具有优势。单阶段检测模型包含以下3个模块:1)特征提取模块:将图像数据输入到合适的特征提取网络中,利用在ImageNet数据集上训练好的参数初始化该特征提取网络,生成不同尺度的特征图; 2)RPN逐像素点生成大量候选框,这些候选框映射到输入的特征图上,送入到检测模块; 3)利用分类分支判断目标类别,回归分支调整候选框的位置。由于单阶段模型是将包含候选框的特征图直接输入检测模块进行分类和回归,具有较快的检测速度。所以本文选择使用单阶段的检测算法应用在SAR图像检测,单阶段检测模型如图 1所示。


为了提高检测模型的检测精度,引入了特征金字塔网络(feature pyramid networks,FPN)(Lin等,2017a)。FPN包括两个步骤:首先残差网络提取生成

2 AR-Net模型
合成孔径雷达成像的原理决定了SAR图像包含更少的特征信息,雷达照射粗糙物体表面形成相干斑噪声的影响,所以直接将SAR图像应用于Reti-nanet等单阶段检测网络(Wang等,2019b)并不能得到理想的效果。传统金字塔网络虽然能够将高层语义信息融合到底层,但是高层特征缺少底层丰富的位置信息,在物体多为小目标的SAR图像中,容易出现小目标漏检情况。相干斑噪声(马晓双等,2015)使得图像质量下降,隐藏图像精细结构,目标边缘模糊,导致候选框不能完全包围目标。因此本文提出了自适应权重金字塔(adaptive weight pyramid, AWP)和分支强相关(strongly related branch, SRB)的检测网络,该检测模型结构图如图 3所示。

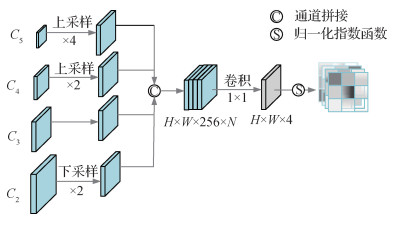
该AR-Net (adaptive weight pyramid and strongly related branch network)网络的特征提取模块采用残差网络(ResNet101)(He等,2016),其中{conv2,conv3,conv4,conv5}分别有3、4、23、3个残差块,与conv1层的7×7卷积层和3×3最大池化层,共有101个卷积层。每个残差块有2个1×1卷积层和1个3×3卷积层,每一层的最后一个残差块步长为2,因此经过每一层特征提取,特征图尺度会下降一半。之后将每层生成的特征图输入到自适应权重特征融合模块,在该模块下,首先将不同尺度大小的特征图经过上采样或下采样到同一尺度,采样得到的特征图与其对应的权重相乘,并对结果相加作为该层的输出特征。输出的特征图送入检测模块,为了有更好的检测效果,对分类分支和回归分支分别输入融合模块重新整合特征图。使用分类分支对目标进行判别,使用回归分支调整检测框,IoU分支作用于分类分支指导回归分支调整检测框,最终得到理想的检测效果。
2.1 自适应权重金字塔
经过残差网络提取特征,高层特征语义信息较为丰富,底层特征空间位置信息较为丰富。SAR图像目标尺度多变,采用
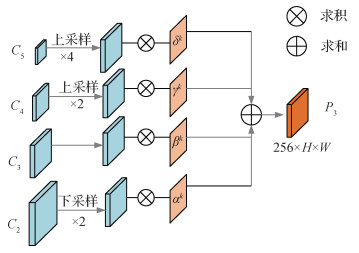
以构造
| $ \begin{gathered} F_{(i, j)}^k=\alpha_{(i, j)}^k \cdot X_{(i, j)}^{2 \rightarrow k}+\beta_{(i, j)}^k \cdot X_{(i, j)}^{3 \rightarrow k}+ \\ \gamma_{(i, j)}^k \cdot X_{(i, j)}^{4 \rightarrow k}+\delta_{(i, j)}^k \cdot X_{(i, j)}^{5 \rightarrow k} \end{gathered} $ | (1) |
式中,
以构造
| $ \alpha_{(i, j)}^k =\frac{\mathrm{e}^{\alpha_{(i, j)}^k}}{\mathrm{e}^{\alpha_{(i, j)}^k}+\mathrm{e}^{\beta_{(i, j)}^k}+\mathrm{e}^{\gamma_{(i, j)}^k}+\mathrm{e}^{\delta_{(i, j)}^k}} $ | (2) |
| $ \beta_{(i, j)}^k =\frac{\mathrm{e}^{\beta_{(i, j)}^k}}{\mathrm{e}^{\alpha_{(i, j)}^k}+\mathrm{e}^{\beta_{(i, j)}^k}+\mathrm{e}^{\gamma_{(i, j)}^k}+\mathrm{e}^{\delta_{(i, j)}^k}} $ | (3) |
| $ \gamma_{(i, j)}^k =\frac{\mathrm{e}^{\gamma_{(i, j)}^k}}{\mathrm{e}^{\alpha_{(i, j)}^k}+\mathrm{e}_{(i, j)}^{\beta_{(i, j}^k}+\mathrm{e}^{\gamma_{(i, j)}^k}+\mathrm{e}^{\delta_{(i, j)}^k}} $ | (4) |
| $ \delta_{(i, j)}^k =\frac{\mathrm{e}^{\delta_{(i, j)}^k}}{\mathrm{e}^{\alpha_{(i, j)}^k}+\mathrm{e}_{(i, j)}^{\beta_{(i, j)}^k+\mathrm{e}^{\gamma_{(i, j)}^k}+\mathrm{e}^{\delta_{(i, j)}^k}}} $ | (5) |
式中,
以
| $ \begin{gathered} \frac{\partial L}{\partial X_{(i, j)}^k}=\alpha_{(i, j)}^2 \cdot \frac{\partial L}{\partial F_{(i, j)}^2}+\alpha_{(i, j)}^3 \cdot \frac{\partial L}{\partial F_{(i, j)}^3}+ \\ \alpha_{(i, j)}^4 \cdot \frac{\partial L}{\partial F_{(i, j)}^4}+\alpha_{(i, j)}^5 \cdot \frac{\partial L}{\partial F_{(i, j)}^5} \end{gathered} $ | (6) |
式中,
2.2 分支强相关模块
由于相关斑噪声和复杂背景导致的目标边缘模糊,舰船目标特征不明显,从而影响模型的检测效果。分类分支和回归分支是两个单独的分支,在检测过程中分类分支无法指导回归分支对检测框的调整,导致检测框不能理想的包围目标。本文提出分支强相关模块,通过添加IoU分数,避免高IoU低分类分数的检测框被抑制。然后通过融合模块对分类分支和回归分支特征进行融合,融合模块结构如图 6所示。
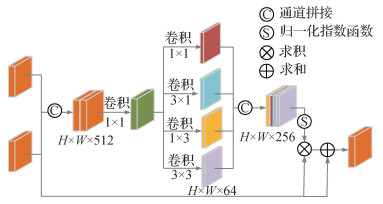
该模块首先将拼接生成的特征图送入1×1卷积层,然后做4种不同卷积核的卷积操作,生成4个64通道数的特征图,最后对拼接生成的特征图送入Softmax,生成一个[0, 1]的权重图,实现两个特征融合。
图 3中生成的IoU与分类得分相乘,采用
| $ S_{\mathrm{cls}}=iou_{(i, j)}^\alpha \cdot P_{(i, j)}^{(1-\alpha)} $ | (7) |
式中,
表 1
不同权重检测结果
Table 1
Different weight detection results
| 检测结果/% | ||||
| 召回率 | 精确率 | 平均精度 | ||
| 0.1 | 94.64 | 92.64 | 90.37 | 93.63 |
| 0.2 | 94.52 | 93.45 | 90.42 | 93.98 |
| 0.3 | 93.63 | 93.51 | 90.31 | 93.57 |
| 0.4 | 93.63 | 95.08 | 90.53 | 94.35 |
| 0.5 | 94.01 | 93.42 | 90.45 | 93.71 |
| 0.6 | 94.52 | 92.40 | 90.39 | 93.45 |
2.3 损失函数
本文模型是逐像素点生成预测框,通过预测框真实标签对比得到最终结果,所以会处理大量没有舰船目标的负样本。为了解决正负样本不均衡的问题,采用focal loss(Lin等,2017b)做分类优化,定义为
| $ \begin{gathered} L_{\mathrm{cls}}= \\ \begin{cases}-\alpha\left(1-p_{(i, j)}\right)^\gamma \log p_{(i, j)} & p_{(i, j)} \text { 是正样本 } \\ -(1-\alpha) p_{(i, j)}^\gamma \log \left(1-p_{(i, j)}\right) & \text { 其他 }\end{cases} \end{gathered} $ | (8) |
式中,
| $ L_{\text {reg }}= \begin{cases}0.5 \times\left(\sigma \times X_{(i, j)}\right)^2 & \left|X_{(i, j)}\right|<1 \\ \left|X_{(i, j)}\right|-0.5 / \sigma^2 & \text { 其他 }\end{cases} $ | (9) |
式中,
| $ \begin{aligned} &L_{\text {iou }}=-i o u_{(i, j)}^* \log \left(i o u_{(i, j)}\right)- \\ &\left(1-i o u_{(i, j)}^*\right) \log \left(1-i o u_{(i, j)}\right) \end{aligned} $ | (10) |
式中,
| $ \begin{gathered} L_{\text {total }}=\frac{1}{N_{\mathrm{all}}} \sum\limits_{i, j} L_{\mathrm{cls}}\left(p_{(i, j)}\right)+\frac{1}{N_{\mathrm{pos}}} \sum\limits_{i, j \in \mathrm{pos}} L_{\mathrm{reg}}\left(t_{i, j}, t_{(i, j)}^*\right)+ \\ \frac{1}{N_{\mathrm{pos}}} \sum\limits_{i, j \in \mathrm{pos}} L_{\mathrm{iou}}\left(\operatorname{iou}_{(i, j)}, \operatorname{iou}_{(i, j)}^*\right) \end{gathered} $ | (11) |
式中,
3 实验结果和分析
实验环境为ubuntu16.04操作系统,搭载CPU为Corei7-7700,显卡为NVIDIA GTX1080Ti,显存为11 GB,在Tensorflow框架下运行,通过CUDA8.0和cuDNN5.0加速训练。该模型学习率设置为0.000 5,每40 k次迭代学习率衰减1/10,在80 k次迭代网络完全收敛。非极大值抑制阈值(Bodla等,2017)为0.5,预测概率阈值为0.6。
本文实验数据选自国内外首个公开的SAR图像SSDD(SAR ship detection dataset)数据集,该数据集的数据主要由Sentinel-1、RadarSat-2和TerraSAR-X卫星传感器获取,采用HH(horizontal, H)、HV(vertical, V)、VV、VH共4种极化方式,传感器分辨率为1~15 m。将有目标区域裁剪为500×500像素,按照PASCAL VOC(pattern analysis, statistical modeling and computational learning visual object class)数据集方式制作真值标签。SSDD数据集中共有1 160幅图像,包含2 456个舰船目标,平均每幅图像包含2.12个舰船目标。包括受岛礁、建筑等复杂背景影响的近海岸场景,多为小尺度舰船的远海场景和带有海洋杂波噪声场景,SSDD数据集基本信息见表 2。本文通过7 : 3的比例将数据集分为训练集和测试集,由于SSDD数据集数量少,为保证模型具有更好的训练效果,对训练集进行数据增广操作,最终训练集达到3 248幅。
表 2
SSDD数据集基本信息
Table 2
Basic information of SSDD dataset
| 传感器 | 分辨率/m | 极化方式 | 场景 |
| RadarSat-2 TerraSAR-X Sentinel-1 | 1~15 | HH、HV、VV、VH | 近海岸、远海、海洋杂波噪声 |
3.1 数据增广
训练过程中,为了提高模型的鲁棒性和学习能力,需要对SAR图像数据增广。常见SAR图像增广的方式有翻转、改变视角、尺度变化和图像压缩,根据SAR图像单通道的特点选择翻转、添加高斯噪声(Lee和Seo,2005)以及改变亮度,数据增广能避免因数据较少而产生的过拟合现象。图 7为数据增广示例。

3.2 评价指标
用召回率(recall)、精确率(precision)和平均精度(average precision,AP)来表示SAR图像舰船检测的效果,计算为
| $ R=\frac{T P}{T P+F N} $ | (12) |
| $ P=\frac{T P}{T P+F P} $ | (13) |
| $ A P=\int_0^1 P(R) \mathrm{d}(R) $ | (14) |
式中,
| $ F_1=\frac{2 T P}{2 T P+F P+F N} $ | (15) |
3.3 消融实验
自适应权重金字塔更好地融合高层语义信息和底层空间位置信息,能够有效检测小目标。分支强相关模块增强分类分支和回归分支在反向传播过程的依赖性,通过IoU指导回归分支,避免高IoU低分类置信度的候选框被抑制。为了证明每个模块的有效性,本文通过对召回率、精确率、平均精度以及
表 3
消融实验结果
Table 3
Results of ablation experiments
| AWP | SRB | 召回率/% | 精确率/% | 平均精度/% | 检测速度/ (帧/s) | |
| × | × | 89.17 | 87.94 | 86.91 | 88.55 | 21.4 |
| √ | × | 90.06 | 90.52 | 89.76 | 90.29 | 21.2 |
| × | √ | 89.29 | 90.57 | 89.22 | 85.56 | 20.7 |
| √ | √ | 93.63 | 95.08 | 90.53 | 94.35 | 20.1 |
| 注:×为没有添加该模块,√为添加该模块。 | ||||||
由表 3可以看出,原始模型效果最差,因为输入检测模块的特征图空间位置信息和语义信息不丰富,目标区域不明显,小目标漏检严重。本文提出的自适应权重特征金字塔,能够平衡高层语义信息和底层空间位置信息,输入检测模块的特征图舰船信息更显著,在检测中召回率提升了0.89%,精确率提升了2.58%,平均精度提升了2.85%,
为了分析AR-Net模型在不同场景下的检测效果,选取包含近海岸和远海舰船目标的SAR图像,对比实验前后检测效果,检测效果如图 8所示。

自适应权重特征金字塔能够充分融合语义信息和空间位置信息,为展示该模块融合效果,本文对融合前后的特征图在Tensorboard上进行可视化,可视化特征图如图 9所示。
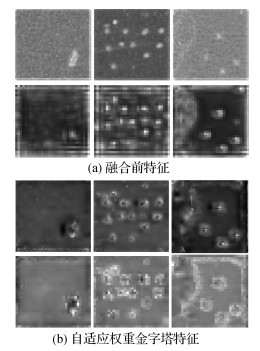
根据图 9可以看出,在SAR图像中经过自适应权重特征融合后的特征图目标更加明确,经过平滑后的特征图目标更加突出,更好地反映出目标位置。对于高层特征图,由于分辨率低,小目标模糊严重,不适合对小目标的检测。所以对于小目标检测底层特征尤其重要,经过自适应权重金字塔,提高了检测网络对小目标的关注度。
3.4 对比实验
本文与其他方法进行了实验对比,以验证AR-Net模型的效果。双阶段Faster R-CNN检测模型,Faster R-CNN检测阶段首先经过第1阶段粗略调节候选框,然后在第2阶段进一步精细调节;单阶段FCOS(full convolutional one-stage)检测模型,该模型摒弃了传统的锚框,实现无锚框检测;FPN特征金字塔,FPN对特征图采用自上而下的特征融合机制,相邻的上层特征图和下层特征图实现简单的特征融合;YOLOv3将输入图像平均切分为多个网格,将网格输入检测网络;张筱晗等人(2020)设计了双向高低层特征融合机制,高层特征进行逐像素加权,将高层的语义信息加到低层,低层空间位置信息加到高层。对比结果见表 4。
表 4
算法性能对比
Table 4
Algorithm performance comparison
| 方法 | 召回率/% | 精确率/% | 平均精度/% | 检测速度/(帧/s) | |
| Faster R-CNN(Ren等,2017) | 88.54 | 88.09 | 87.26 | 88.31 | 9.72 |
| FCOS(Tian等,2019) | 88.02 | 90.80 | 86.48 | 89.39 | 22.78 |
| FPN (Lin等,2017a) | 89.17 | 86.41 | 87.92 | 87.78 | 16.17 |
| YOLOv3 (Redmon和Farhadi,2018) | 88.60 | 90.30 | 89.74 | 89.40 | - |
| 张筱晗等人(2020) | 96.68 | 89.60 | 80.13 | 92.01 | 10.18 |
| Dense-FPN(Huang等,2017) | 90.19 | 87.84 | 89.11 | 89.00 | 12.69 |
| AR-Net(本文) | 93.63 | 95.08 | 90.53 | 94.35 | 20.14 |
| 注:加粗字体表示各列最优结果;“-”表示无此项结果值。 | |||||
从表 4可以看出,双阶段的Faster R-CNN与单阶段的FCOS相比,具有更高的检测精度。FPN能够至上而下融合高层语义信息,平均精度达87.92%,Dense-FPN算法实现对每一层特征的融合,使得每一层特征都含有其他层的特征信息,检测精度最佳。但是双阶段和密集金字塔检测速度慢,无法满足实时性要求。相比其他模型, AR-Net具有更高的检测精度,同时也能满足实时性检测的需求,因此总体来看,AR-Net算法在SSDD数据集中具有更好的检测效果。为了直观展现不同模型的检测效果,本文通过各个模型的PR(precision-recall)图进行对比,如图 10所示。

3.5 泛化能力测试
为了证明AR-Net的泛化能力,对数据集进行两种不同方式的数据分割:1)将数据集按照{8 : 2、7 : 3、6 : 4、5 : 5}不同比例随机分割; 2)将数据集按照7 : 3的比例多次随机分割。本文将多种样本的召回率、精确率、平均精度和
表 5
不同比例样本分割
Table 5
Sample cutting in different proportions
| /% | |||||||||||||||||||||||||||||
| 比例划分 | 召回率 | 精确率 | 平均精度 | ||||||||||||||||||||||||||
| 8 : 2 | 92.50 | 95.63 | 90.60 | 94.04 | |||||||||||||||||||||||||
| 7 : 3 | 93.63 | 95.08 | 90.53 | 94.35 | |||||||||||||||||||||||||
| 6 : 4 | 92.05 | 95.56 | 90.55 | 93.77 | |||||||||||||||||||||||||
| 5 : 5 | 93.21 | 94.05 | 90.49 | 93.63 | |||||||||||||||||||||||||
| 均值/% | 92.85 | 95.08 | 90.54 | 93.95 | |||||||||||||||||||||||||
| 方差 | 0.375 1 | 0.398 5 | 0.001 5 | 0.075 7 | |||||||||||||||||||||||||
表 6
相同比例多次样本分割
Table 6
Multiple sample cuts in the same proportion
| /% | |||||||||||||||||||||||||||||
| 分割次数 | 召回率 | 精确率 | 平均精度 | ||||||||||||||||||||||||||
| 第1次 | 93.24 | 95.70 | 90.56 | 94.46 | |||||||||||||||||||||||||
| 第2次 | 93.63 | 95.08 | 90.53 | 94.35 | |||||||||||||||||||||||||
| 第3次 | 92.48 | 95.83 | 90.50 | 94.13 | |||||||||||||||||||||||||
| 第4次 | 92.89 | 94.77 | 90.59 | 93.82 | |||||||||||||||||||||||||
| 均值/% | 93.06 | 95.35 | 90.55 | 94.19 | |||||||||||||||||||||||||
| 方差 | 0.180 7 | 0.190 5 | 0.001 1 | 0.059 8 | |||||||||||||||||||||||||
从表 5中可以看出,经过不同比例分割的测试样本中样本数量不同,舰船目标数量差别较大。但是AR-Net的平均精度均在90.54%上下浮动,平均精度的方差为0.001 1,
3.6 不同场景下检测效果
SSDD数据集中包含近岸和远海舰船目标,本文选取不同场景不同尺度的目标检测效果。第1行、第2行为近海岸舰船,容易受到周边非舰船目标的影响,同时密集停靠舰船目标的高IoU低分类分数的候选框被抑制,导致一个框含有多个目标的情况;第3行为远海大目标,容易出现目标定位不准确;第4行为远海密集小目标,舰船目标尺度小,容易漏检;第5行带有相干斑噪声,背景信息复杂,目标边缘不清晰。可以看出,对于以上各种场景的目标AR-Net都能有理想的检测效果,各种场景检测效果如图 11所示。

4 结论
由于SAR图像复杂的背景信息,针对小目标检测效果差和检测框不能很好地包围目标的问题,本文提出了一种自适应权重特征融合金字塔和分支强相关的检测模型AR-Net。自适应融合高层语义信息和底层空间位置信息,使得待检测的特征图既具有语义信息又包含空间位置信息;另外IoU分支指导回归分支优化检测框,获得更精准的检测框。在SSDD数据集上与其他舰船检测方法对比,在速度损耗有限的情况下,该模型具有更好的检测精度和鲁棒性。虽然该模型具有较好的检测精度,但是在舰船停靠密集的场景,检测框大量重叠,检测框之间相互抑制,容易出现定位不准和目标漏检,这是因为水平检测框没有旋转检测框更加精准。下一步的任务是对密集排列的舰船目标有更好的检测效果。
参考文献
-
Abu A, Diamant R. 2020. CFAR detection algorithm for objects in sonar images. IET Radar, Sonar and Navigation, 14(11): 1757-1766 [DOI:10.1049/iet-rsn.2020.0230]
-
Bodla N, Singh B, Chellappa R and Davis L S. 2017. Soft-NMS-improving object detection with one line of code//Proceedings of 2017 IEEE International Conference on Computer Vision. Venice, Italy: IEEE: 5562-5570 [DOI:10.1109/iccv.2017.593]
-
Chang Y L, Anagaw A, Chang L, Wang Y C, Hsiao C Y, Lee W H. 2019. Ship detection based on YOLOv2 for SAR imagery. Remote Sensing, 11(7): #786 [DOI:10.3390/rs11070786]
-
Chicco D, Jurman G. 2020. The advantages of the Matthews correlation coefficient (MCC) over F1 score and accuracy in binary classification evaluation. BMC Genomics, 21(1): #6 [DOI:10.1186/s12864-019-6413-7]
-
Girshick R. 2015. Fast R-CNN//Proceedings of 2015 IEEE International Conference on Computer Vision. Santiago, Chile: IEEE: 1440-1448 [DOI:10.1109/ICCV.2015.169]
-
Guo C X, Fan B, Zhang Q, Xiang S M and Pan C H. 2020. AugFPN: improving multi-scale feature learning for object detection//Proceedings of 2020 IEEE/CVF Conference on Computer Vision and Pattern Recognition. Seattle, USA: IEEE: 12595-12601 [DOI:10.1109/CVPR42600.2020.01261]
-
He K M, Zhang X Y, Ren S Q and Sun J. 2016. Deep residual learning for image recognition//Proceedings of 2016 IEEE Conference on Computer Vision and Pattern Recognition. Las Vegas, USA: IEEE: 770-778 [DOI:10.1109/CVPR.2016.90]
-
Huang G, Liu Z, Van Der Maaten L and Weinberger K Q. 2017. Densely connected convolutional networks//Proceedings of 2017 IEEE Conference on Computer Vision and Pattern Recognition. Honolulu, USA: IEEE: 2261-2269 [DOI:10.1109/cvpr.2017.243]
-
Lee S H, Seo J K. 2005. Noise removal with Gauss curvature-driven diffusion. IEEE Transactions on Image Processing, 14(7): 904-909 [DOI:10.1109/tip.2005.849294]
-
Lin T Y, Dollár P, Girshick R, He K M, Hariharan B and Belongie S. 2017a. Feature pyramid networks for object detection//Proceedings of 2017 IEEE Conference on Computer Vision and Pattern Recognition. Honolulu, USA: IEEE: 936-944 [DOI:10.1109/cvpr.2017.106]
-
Lin T Y, Goyal P, Girshick R, He K M and Dollár P. 2017b. Focal loss for dense object detection//Proceedings of 2017 IEEE International Conference on Computer Vision. Venice, Italy: IEEE: 2999-3007 [DOI:10.1109/ICCV.2017.324]
-
Liu W, Anguelov D, Erhan D, Szegedy C, Reed S, Fu C Y and Berg A C. 2016. SSD: single shot MultiBox detector//Proceedings of the 14th European Conference on Computer Vision. Amsterdam, the Netherlands: Springer: 21-37 [DOI:10.1007/978-3-319-46448-0_2]
-
Ma X S, Shen H F, Yang J, Zhang L P. 2015. Polarimetric SAR speckle filtering using a nonlocal weighted minimum mean squared error filter. Journal of Image and Graphics, 20(1): 140-150 (马晓双, 沈焕锋, 杨杰, 张良培. 2015. 极化SAR相干斑抑制的非局部加权最小均方误差滤波算法. 中国图象图形学报, 20(1): 140-150) [DOI:10.11834/jig.20150115]
-
Malhotra R, Shakya A, Ranjan R, Banshi R. 2021. Software defect prediction using binary particle swarm optimization with binary cross entropy as the fitness function. Journal of Physics: Conference Series, 1767: #012003 [DOI:10.1088/1742-6596/1767/1/012003]
-
Redmon J and Farhadi A. 2018. Yolov3: an incremental improvement[EB/OL]. [2018-04-08]. https://arxiv.org/pdf/1804.02767.pdf
-
Ren S Q, He K M, Girshick R, Sun J. 2017. Faster R-CNN: towards real-time object detection with region proposal networks. IEEE Transactions on Pattern Analysis and Machine Intelligence, 39(6): 1137-1149 [DOI:10.1109/TPAMI.2016.2577031]
-
Sugimoto M, Ouchi K, Nakamura Y. 2013. On the novel use of model-based decomposition in SAR polarimetry for target detection on the sea. Remote Sensing Letters, 4(9): 843-852 [DOI:10.1080/2150704X.2013.804220]
-
Tian Z, Shen C H, Chen H and He T. 2019. FCOS: fully convolutional one-stage object detection//Proceedings of 2019 IEEE/CVF International Conference on Computer Vision. Seoul, Korea(South): IEEE: 9626-9635 [DOI:10.1109/iccv.2019.00972]
-
Wang C C, Wang Y, Liao M S. 2012. Removal of azimuth ambiguities and detection of a ship: using polarimetric airborne C-band SAR images. International Journal of Remote Sensing, 33(10): 3197-3210 [DOI:10.1080/01431161.2011.633123]
-
Wang J Q, Chen K, Yang S, Loy C C and Lin D H. 2019a. Region proposal by guided anchoring//Proceedings of 2019 IEEE/CVF Conference on Computer Vision and Pattern Recognition. Long Beach, USA: IEEE: 2965-2974 [DOI:10.1109/CVPR.2019.00308]
-
Wang Y Y, Wang C, Zhang H, Dong Y B, Wei S S. 2019b. Automatic ship detection based on RetinaNet using multi-resolution Gaofen-3 imagery. Remote Sensing, 11(5): #531 [DOI:10.3390/rs11050531]
-
Zhang X H, Yao L B, Lyu Y F, Jian T, Zhao Z W, Zang J. 2020. Data-adaptive single-shot ship detector with a bidirectional feature fusion module for SAR images. Journal of Image and Graphics, 25(9): 1943-1952 (张筱晗, 姚力波, 吕亚飞, 简涛, 赵志伟, 藏洁. 2020. 双向特征融合的数据自适应SAR图像舰船目标检测模型. 中国图象图形学报, 25(9): 1943-1952) [DOI:10.11834/jig.190558]
-
Zhao Y Q, Rao Y, Dong S P, Zhang J Y. 2020. Survey on deep learning object detection. Journal of Image and Graphics, 25(4): 629-654 (赵永强, 饶元, 董世鹏, 张君毅. 2020. 深度学习目标检测方法综述. 中国图象图形学报, 25(4): 629-654) [DOI:10.11834/jig.190307]


